
Figure 3.
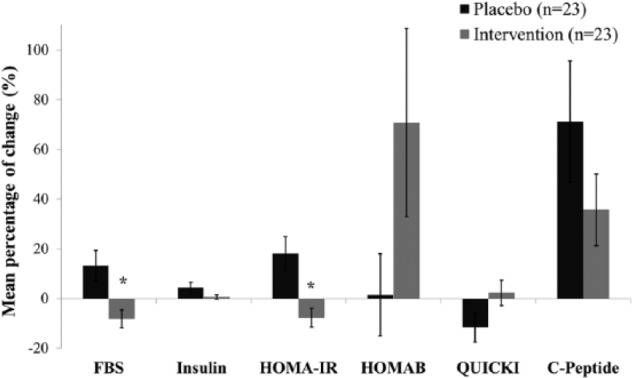
Mean percentage of changes (±SEM) for selected metabolic variables (serum FBG, insulin, C-peptide, and insulin-related variables) between pre- and postdose timelines by which finally compared between LO and HO groups as well. *Independent sample t test: P < .01.