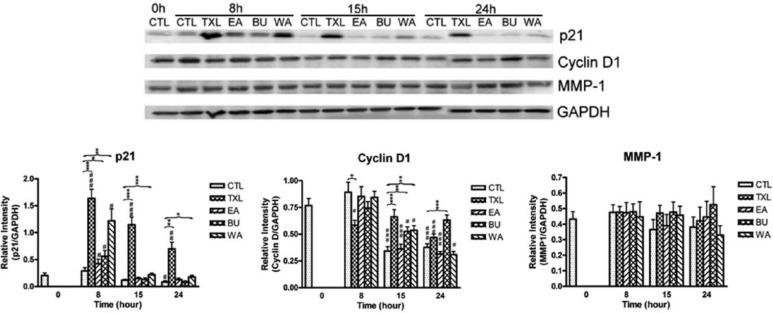
Figure 5.
Protein expression of p21, cyclin D1, and MMP-1 in treated HT-29 cells at different time points. The results are expressed as mean relative intensity ± standard error of the mean (n = 3). Comparison was done by using unpaired t test. CTL, control group.
CTL 0 hours versus treated cells: #P < .05; ##P < .01; ###P < .001.
CTL of corresponding time point versus treated cells: *P < .05; **P < .01; ***P < .001.

