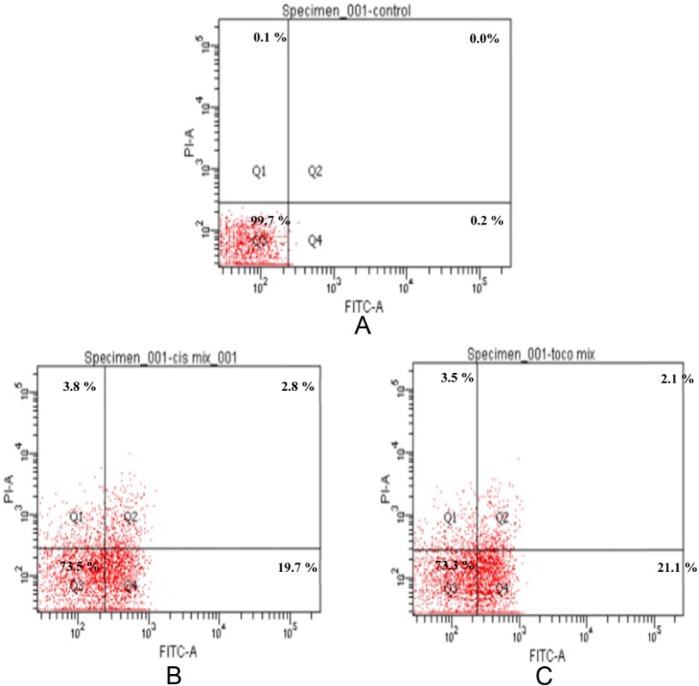
Figure 6.
Dot plots of Annexin V-FITC/PI–stained ORL-48 cells exposed to (A) control (media only), (B) 2.5 µg/mL cisplatin, and (C) 2.5 µg/mL α-tocopherol. The 4 quadrants represent necrotic cells (Q1: Annexin V negative; PI positive), late apoptotic or necrotic cells (Q2: Annexin V positive; PI positive), viable cells (Q3: Annexin V negative; PI negative), and early apoptotic cells (Q4: Annexin V positive; PI negative). Numbers indicate the percentage of cells in each quadrant and a minimum of 10 000 events were read.

