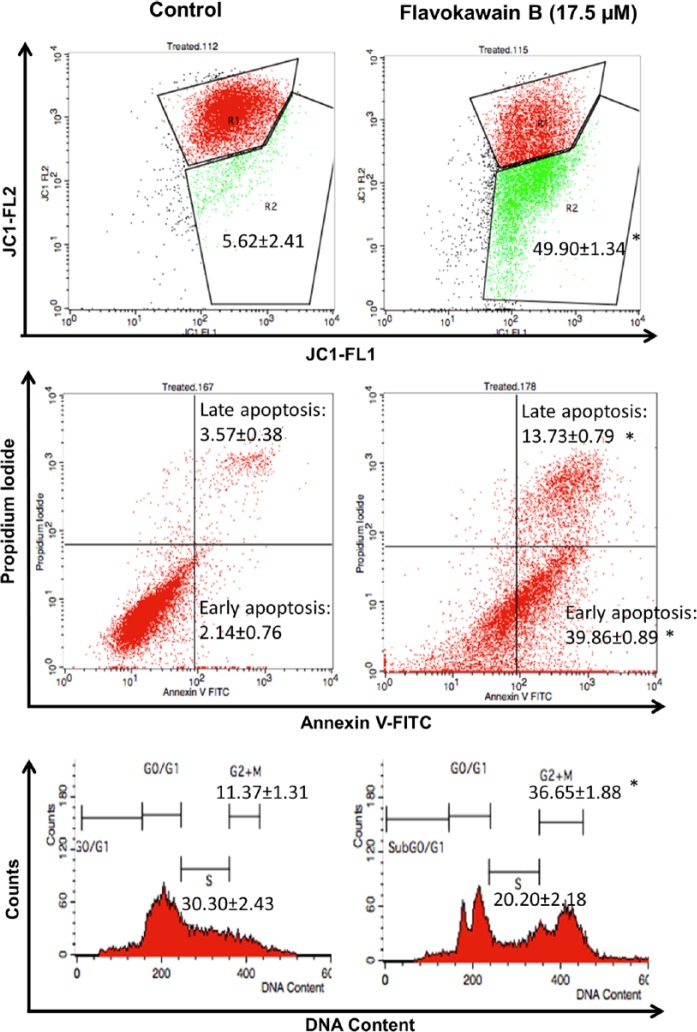
Figure 1.
A. Flow cytometry analysis of the JC-1 assay (mitochondrial membrane potential) in FKB-treated HeLa cells and untreated HeLa cells. R1:R2 represents the monomers to aggregates ratio. B. Flow cytometry analysis of Annexin V assay in FKB-treated HeLa cells and untreated HeLa cells. Upper left quadrant represents the percentage of late apoptosis cell population, and the lower left quadrant represents the early apoptosis cell population. C. Flow cytometry analysis of the cell cycle assay in FKB-treated HeLa cells and untreated HeLa cells. Data represent mean ± SEM for 3 sets of replicates. *P< .05.
Abbreviation: FKB, flavokawain-B.

