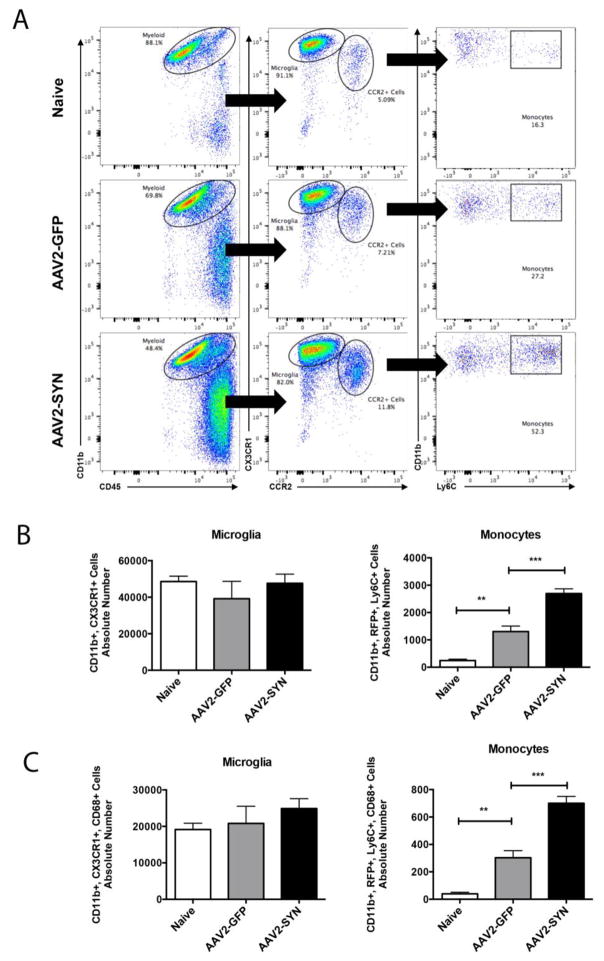
Figure 3. AAV2-SYN expression induces CCR2+, LY6C+ monocyte entry from the periphery.
(A) CD45+, CD11b+, myeloid cell populations were gated into two distinct populations: CX3CR1-GFPhi, CCR2-RFP− resident microglia and CX3CR1-GFPlo, CCR2-RFP+ infiltrating myeloid cells. Further gating on Ly6C showed and increase in the percent of CCR2-RFP+ infiltrating monocytes in AAV2-SYN injected red/green mice. (B) Quantification of the absolute number of microglia and monocytes in the ventral midbrain of Naïve, AAV2-GFP, and AAV2-SYN transduced red/green mice. This experiment involves 28 mice. Individual samples were formed by pooling 2–3 ventral midbrains (bilaterally injected), each from different animals. In each experiment, treatment groups (Naïve, AAV2-GFP, AAV2-SYN) consisted of 4 of these independent samples. For flow cytometry analysis, the mean +/− SEM of the independent samples in each treatment group were plotted. One-way ANOVA with Tukey’s post hoc test, **p<0.01, ***p<0.001. (C) Quantification of the absolute number of CD68+ microglia and monocytes in the ventral midbrain of Naïve, AAV2-GFP, and AAV2-SYN transduced red/green mice. This experiment involves 28 mice. Individual samples were formed by pooling 2 ventral midbrains, each from different animals (bilaterally injected). In each experiment, treatment groups (Naïve, AAV2-GFP, AAV2-SYN) consisted of 4 of these independent samples. For flow cytometry analysis, the mean +/− SEM of the independent samples in each treatment group were plotted. One-way ANOVA with Tukey’s post hoc test, **p<0.01, ***p<0.001. Infiltrating monocytes as well as resident microglia express the myeloid marker, CD68.

