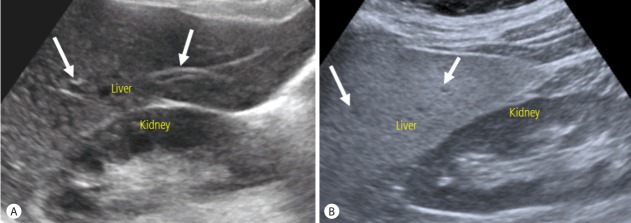
Figure 1.
Evaluation of hepatic steatosis using US. (A) In normal liver, liver parenchymal echogenicity is similar to kidney cortex echogenicity. Wall of portal vein (arrows) are also well visualized. (B) In the presence of hepatic steatosis, liver parenchymal echogenicity increases compared to kidney cortex echogenicity. Wall of portal vein (arrows) are obscured owing to the increased parenchymal echogenicity. US, ultrasonography.

