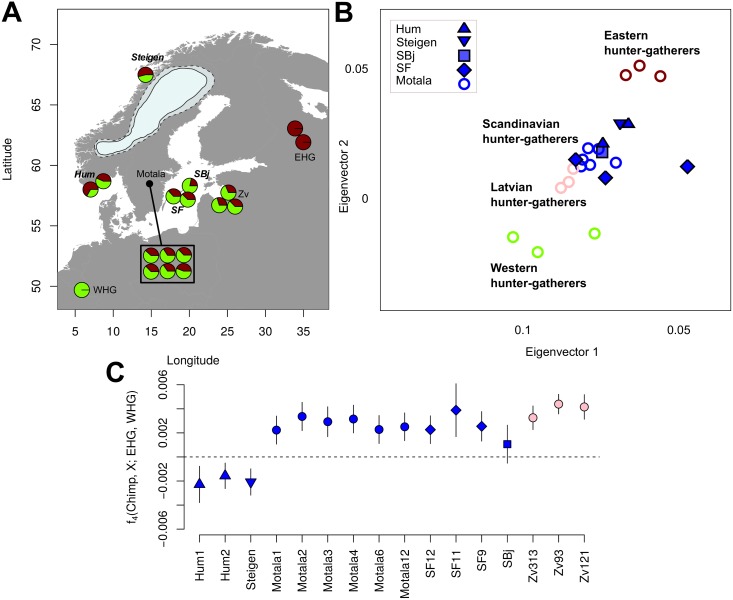
Fig 1. Mesolithic samples and their genetic affinities.
(A) Map of the Mesolithic European samples used in this study. The pie charts show the model-based [18,19] estimates of genetic ancestry for each SHG individual. The map also displays the ice sheet covering Scandinavia 10,000 cal BP (most credible [solid line] and maximum extend [dashed line] following [10]). Newly sequenced individuals are shown with bold and italic site names. SF11 is excluded from this map due to its low coverage (0.1×). Additional European EHG and WHG individuals used in this study derive from sites outside this map. The map was plotted using the R package rworldmap [28]. (B) Magnified section of genetic similarity among ancient and modern day individuals using PCA, featuring only the Mesolithic European samples (see S6 Text for the full plot). Symbols representing newly sequenced individuals have a black contour line. (C) Allele sharing between the SHGs, Latvian Mesolithic hunter-gatherers (Zv) [29], and EHGs versus WHGs measured by the statistic f4(Chimp, SHG; EHG, WHG) calculated for the captured SNPs [20]. Error bars show two block-jackknife standard errors. Data shown in this figure can be found in S1 Data. BP, before present; cal, calibrated; Chimp, Chimpanzee; EHG, eastern hunter-gatherer; PCA, principal component analysis; SHG, Scandinavian hunter-gatherer; WHG, western hunter-gatherer; Zv, Latvian Mesolithic hunter-gatherer from Zvejnieki.

