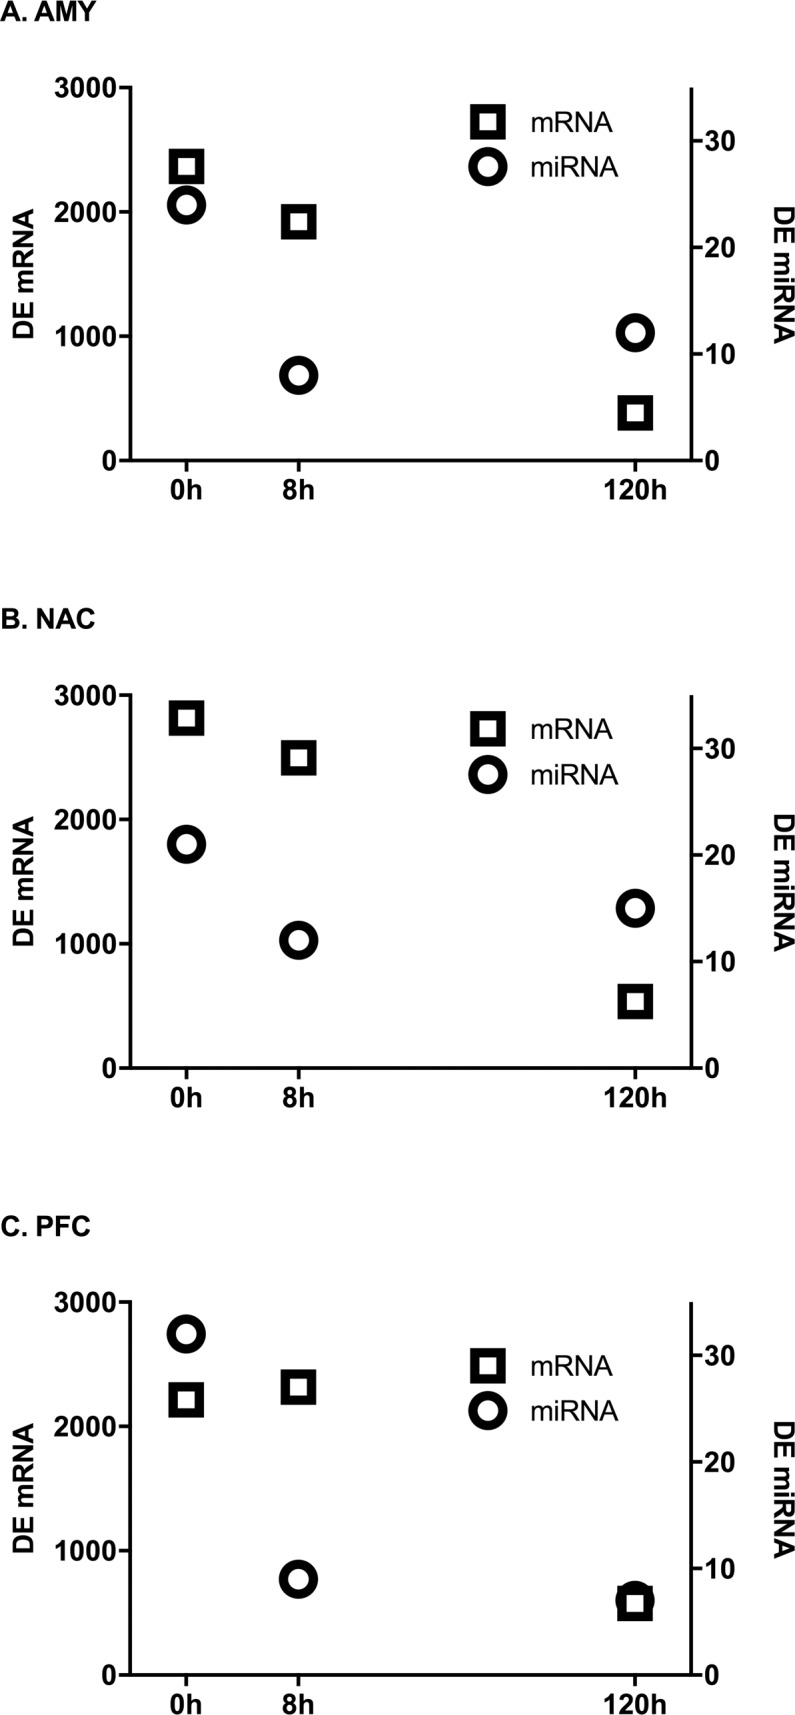
Fig 3. Numbers of microRNAs and mRNAs (from[26]) DE at each time point.

Circles represent microRNAs, squares represent genes. Genes at 0 and 8h were considered DE at an FDR of 0.05. MicroRNAs and 120h mRNAs were considered DE at a nominal value of 0.05.
