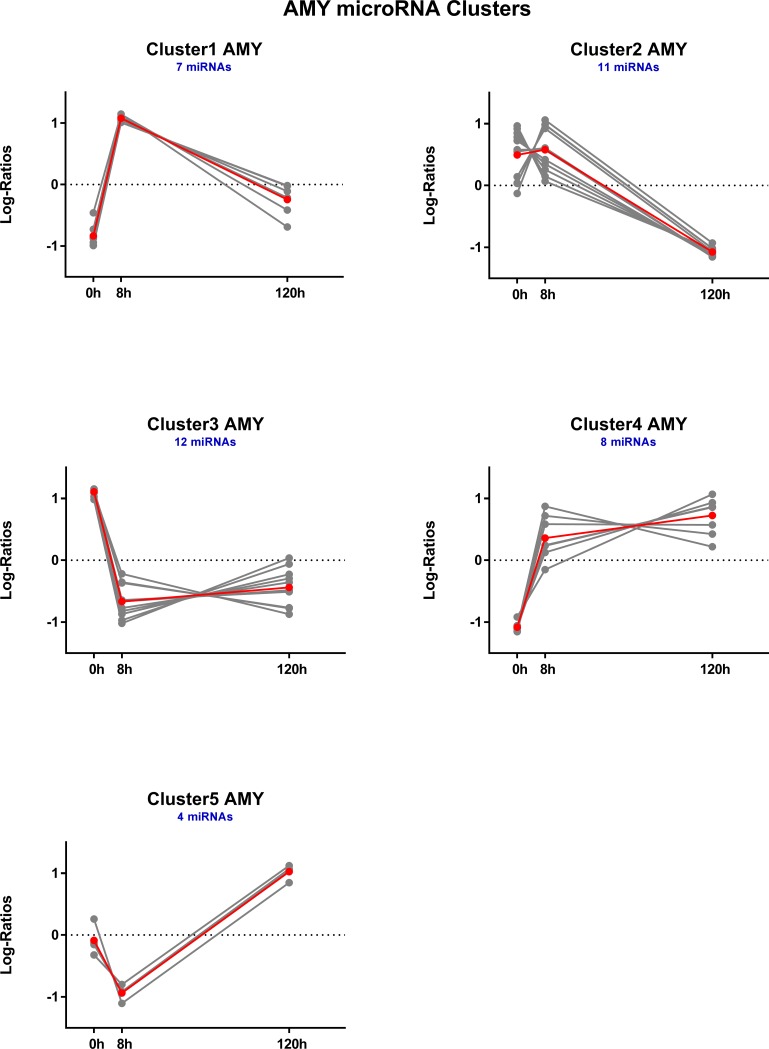
Fig 5. Temporal profiles of hierarchically clustered, DE (p < 0.05) microRNAs in amygdala.
Profiles are based on hierarchical clustering of centered and scaled expression log ratios of microRNAs DE in at least one time point. Average expression is plotted in red, and each individual microRNA is plotted in gray. Blue text indicates the total number of microRNAs in each cluster.

