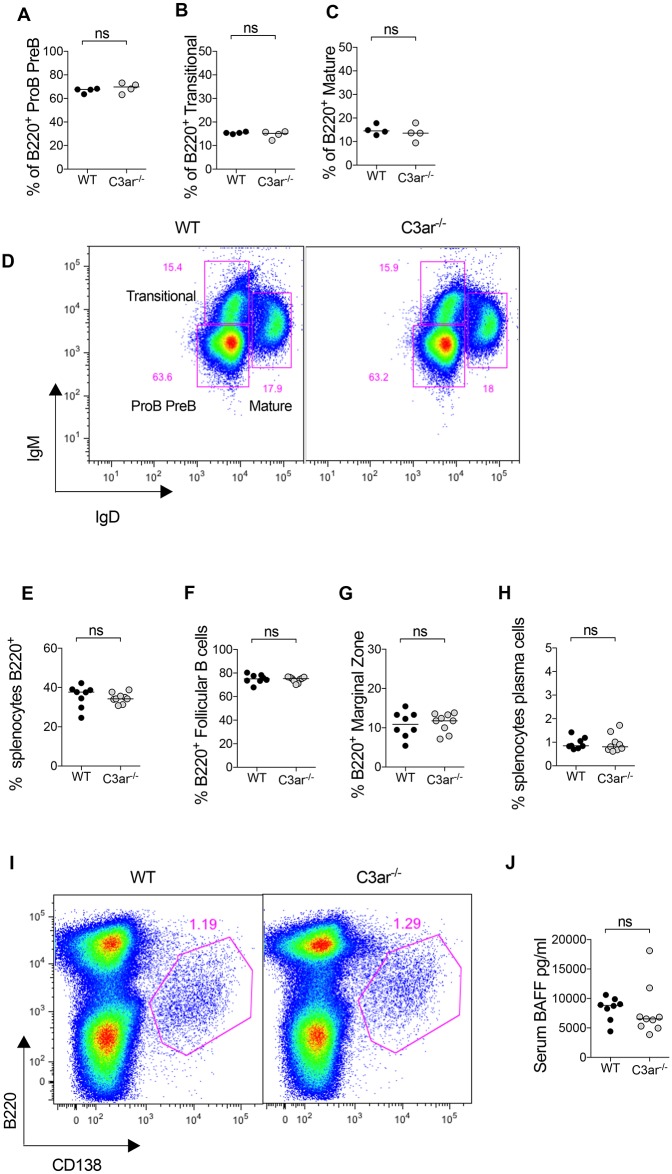
Fig 4. C3ar-/- mice have normal B cell development in the spleen and bone marrow.
Bone marrow cells were extracted from tibiae of naïve WT and C3ar-/- mice (n = 4/group) and surface markers analysed by flow cytometry. (A-C) The proportion of B220+ cells that were preB or proB (IgMlowIgDlow), transitional (IgM+IGDlow) or mature (IgM+IgD+) did not differ between groups. (D) Representative flow cytometry plot gated on B220+ cells in the bone marrow showing gating strategy. The splenic B cell compartment was analysed in WT and C3ar-/- mice (n = 8/group) at the end of the autoimmune anti-MPO glomerulonephritis model. There was no difference in (E) the proportion of splenocytes that were B220+ B cells, (F) the proportion of B220+ cells that were CD21+CD23+ follicular B cells, or (G) CD21+CD23low marginal zone B cells was similar between groups. (H) The proportion of splenocytes that were B220low/intCD138+ plasma cells also did not differ between groups. (I) Representative flow cytometry plot of splenocytes showing gating of plasma cells. (J) Serum B cell activating factor (BAFF) was similar between groups.

