Fig 3.

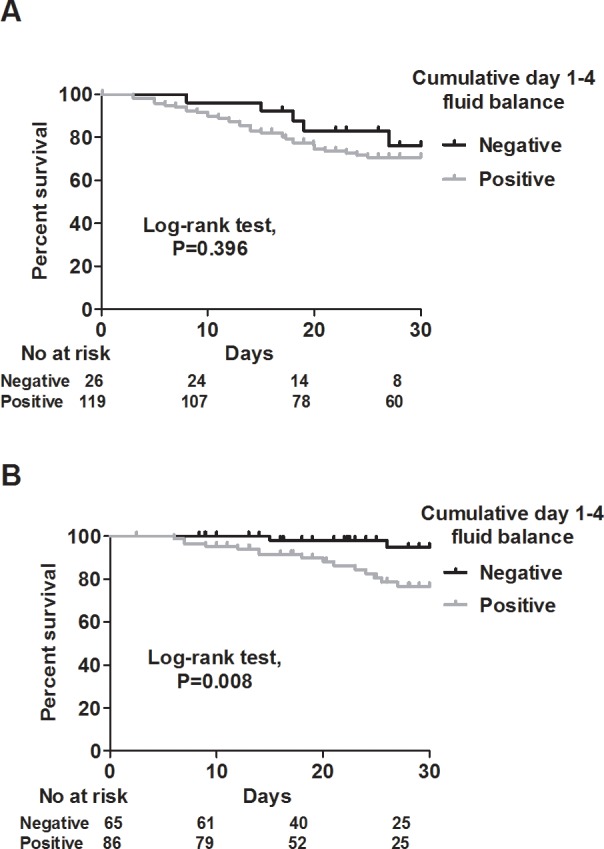
Kaplan-Meier survival curves for positive (gray) and negative (black) cumulative day 1–4 fluid balance in the shock (A) and non-shock (B) groups.

Kaplan-Meier survival curves for positive (gray) and negative (black) cumulative day 1–4 fluid balance in the shock (A) and non-shock (B) groups.