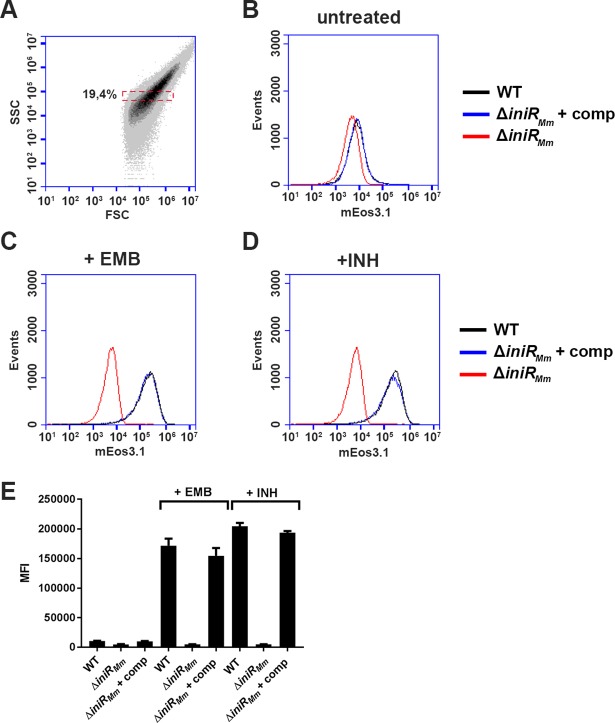
Fig 4. A ΔiniRMm mutant is unable to induce iniBAC upon addition of EMB or INH.
(A) Gating strategy for this experiment. The bacterial population in the red box was selected to measure a population that is roughly equal in size and granularity (measured by forward scatter, FSC and side scatter, SSC). This gated population was used for all samples and a total of 30,000 cells were analyzed per sample (B) Histograms of mEos3.1 fluorescence intensity (in arbitrary units, on the X-axis) of untreated WT M. marinum (black line), an isogenic iniRMm knockout mutant and the iniRMm knockout mutant transformed with an integrative plasmid containing a copy of iniRMm with its native promoter are shown for day 3. (C) Fluorescence induction by EMB (1 μg/ml) is lost in the iniRMm mutant, but restored in the complemented strain to near-WT levels. (D) Fluorescence induction by INH (10 μg/ml) is lost in the iniRMm mutant, but also restored in the complemented strain to near-WT levels. The histograms are from one representative sample of a biological quadruplicate (E) Quantification of the fluorescence induction (in mean fluorescence intensity, MFI) measured on day 3. Measurements were performed in quadruplicate. Error bars indicate s.d. values.

