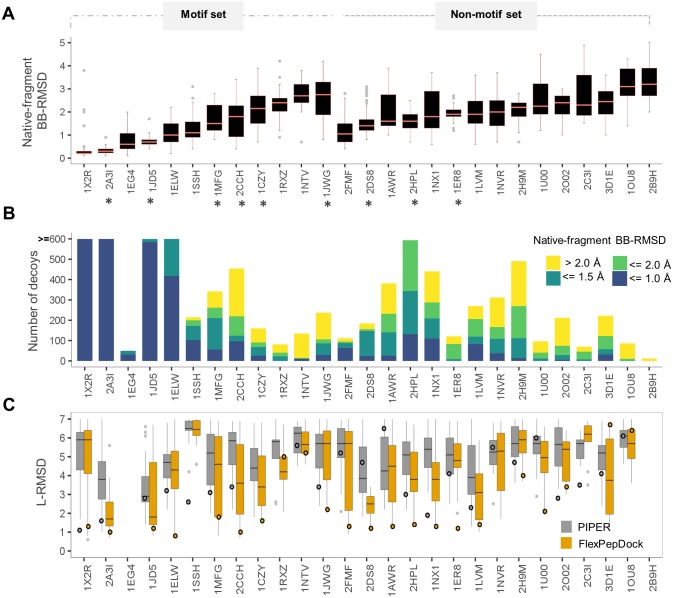
Fig 2. Assessment of performance of the different steps of PIPER-FlexPepDock.
(A) Fragment quality: distribution of fragment backbone RMSDs relative to the native bound peptide conformation (defined as fragment quality). PDBs with and without motif information are grouped separately. The initial calibration set is marked with asterisks (*). (B) PIPER rigid body docking: distribution of the number of models within 5Å ligand (L)-RMSD from the native, colored according to fragment quality. (C) Improvement after FlexPepDock refinement: distribution of the L-RMSDs of the top 1% FlexPepDock refined models (in orange) and corresponding PIPER models (in gray). Shown are the results of runs starting from the unbound receptor structure and including receptor minimizations (see also Fig 3). The circles represent the L-RMSD values of the best model among the top 10 ranking clusters. The Y-axis has been trimmed to 7Å. Note that for the PIPER runs, circles represent the top-ranked model of a PIPER run (including density clustering, as described in Methods and Porter et al. [24]), while the distributions represent the subset of models that served as starting structures for the models selected after FlexPepDock refinement. The former allows the comparison of the final results from a PIPER run to a corresponding PIPER-FlexPepDock run, while the latter shows improvement due to FlexPepDock refinement for the finally selected models.

