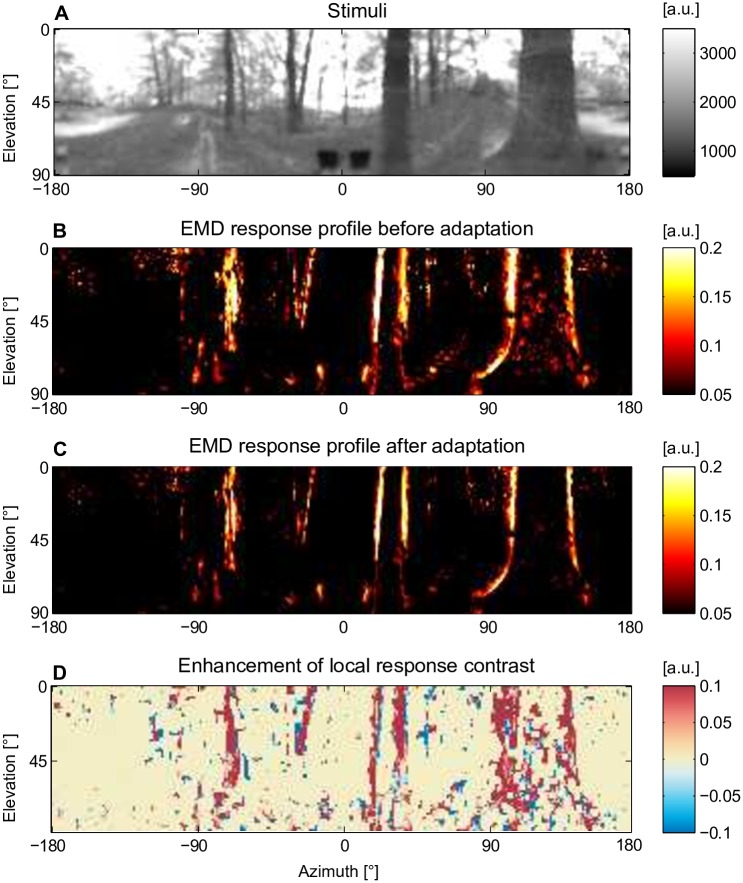
Fig 7. Impact of motion adaptation on the representation of spatial information by arrays of motion detectors during translational flight in a natural cluttered environment.
(A) Middle frame from an image sequence mimicking the retinal input during a translational motion in a forest. The whole stimulus sequence is composed of eight repetitions of a 900-ms-translational optic flow sequence. (B) EMD response profile before motion adaptation (in the middle of the first repetition, t = 450 ms) and (C) after motion adaptation (in the middle of the eighth repetition, t = 6750 ms). (D) Assessment of local response contrast changes with adaptation by subtracting the local response contrast of the EMD profile after adaptation (C) from that before adaptation (B) (red: enhancement and blue: attenuation of local EMD response contrast).

