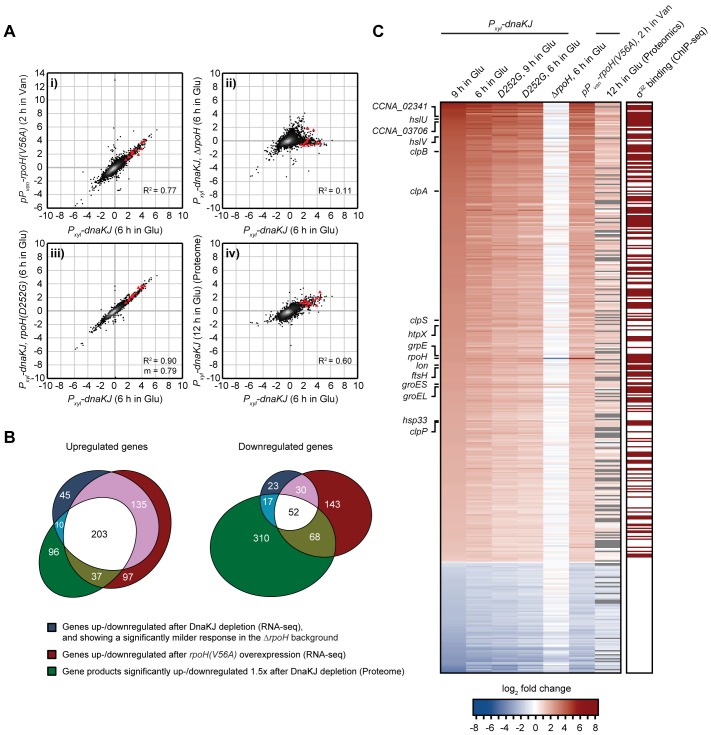
Fig 6. σ32 activation leads to global changes in gene expression.
(A) Gene scatter plots comparing gene expression changes induced by 6 hours of DnaKJ depletion with: i) gene expression changes induced by 2 hours of σ32(V56A)-overproduction in the PdnaK::Tn background, ii) gene expression changes in DnaKJ-depleted cells (6 hours) containing the ΔrpoH mutation iii) gene expression changes in DnaKJ-depleted cells (6 hours) containing the rpoH(D252G) mutation and iv) protein fold changes after 12 h of DnaKJ depletion. All experiments were performed at 30°C. Red triangles represent highly conserved proteases and chaperones that are highlighted in the heat map in (C). m, as the slope of the linear regression is shown when the corresponding R2 designates a close fit of the data points and allows for a direct comparison of gene induction in samples of the same strain background. See S9 Fig for additional gene expression comparisons. (B) Venn diagrams showing groups of up- or downregulated genes that meet the criteria described in the figure. The intersection between the blue and red gene groups (shown in white and pink) was defined as the group of genes affected by σ32-activity. The three-way intersection (shown in white) represents genes of which the corresponding protein is similarly up- or downregulated due to σ32-activity. (C) Heat map showing mRNA and corresponding protein fold changes of σ32-dependent genes identified in (B) (blue and red gene group intersections) in the different genetic backgrounds and growth conditions shown. The right column indicates with a dark red box whether a gene shows a ChIP-seq signal for σ32-enrichment in the promoter region as inferred from previously published ChIP-seq data [38]. Gray bars in the column labeled "12 h in Glu (Proteomics)" indicate that the corresponding protein could not be detected.

