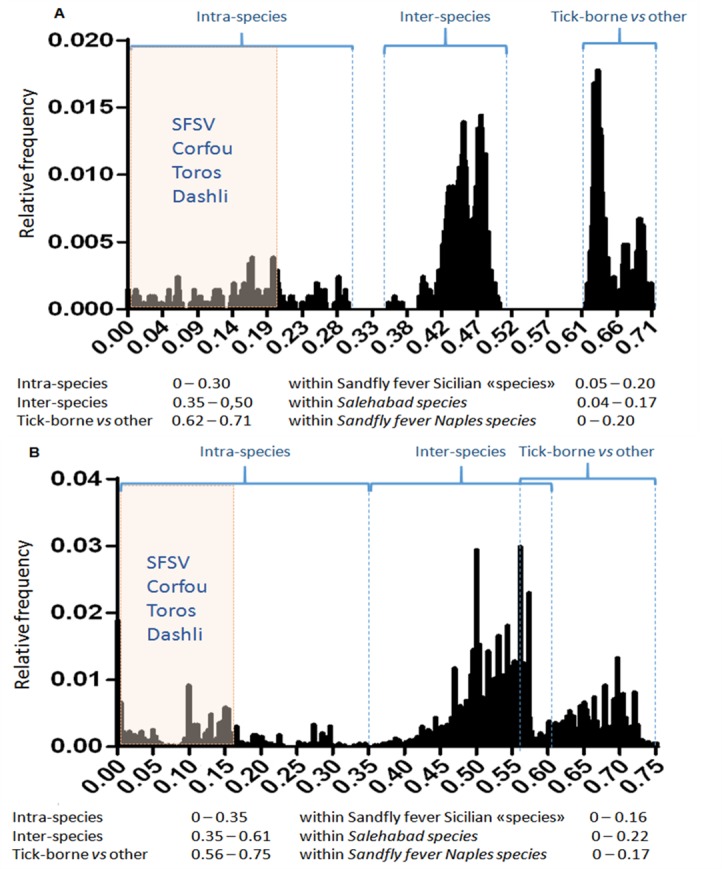
Fig 8. Distribution of evolutionary distances upon amino acid pairwise comparison of the complete open reading frame.

The genetic distance is reported on the x-axis. Frequency of genetic distances is recorded on the y-axis. Distribution of the distances observed between sequences of the L (n = 46) and N (n = 62) ORFs. The shaded square represents AA distances observed between DASHV, SFSV, TORV and CFUV strains. Intra- and interspecific-ranges are indicated.
