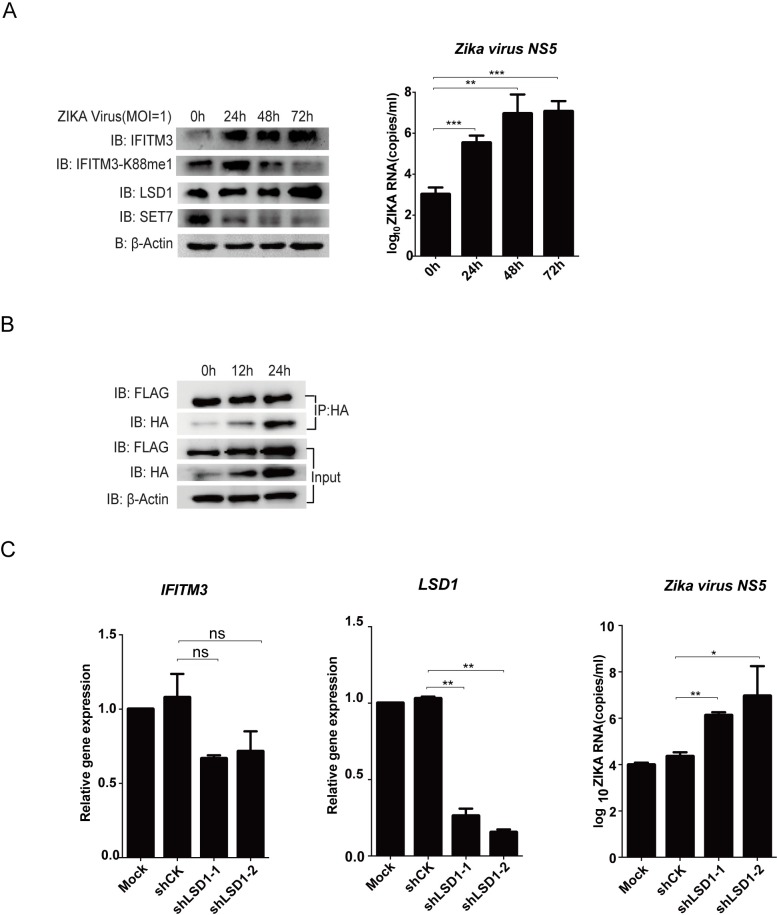
Fig 8. Zika virus infection triggers demethylation of IFITM3.
(A) Zika virus infection increases the monomethylation of IFITM3. Human neural progenitor cells (hNPC) grown in six-well plates were infected with Zika virus at MOI = 1. Cells were then collected at the indicated time-point post-infection for western blot to detect the levels of IFITM3 and IFITM3-K88me1 or for qPCR to detect the NS5 levels of Zika virus. The levels of IFITM3, IFITM3-K88me1, LSD1, SET7 and β-Actin were shown in whole cell lysates. Representative results are shown as above, data were repeated at least three times. The virus growth pattern is shown by Zika virus RNA copies on the right. (B) The levels of IFITM3-associated LSD1 keeps stable under Zika virus infection. Huh7 cells were transfected with HA-IFITM3 and FLAG-LSD1. Forty-eight hours later, cells were infected with Zika virus at MOI = 1. Cells were then collected at the indicated time-point post-infection and were immunoprecipitated with anti-HA antibodies plus protein A/G beads. HA-IFITM3 and FLAG-LSD1 were detected as above, and levels of β-Actin were shown in whole cell lysates (Input). Data were repeated at least three times. (C) Knockdown of LSD1 promotes multiplication of Zika virus. Lentivirus-packaged shRNAs against LSD1 (shLSD1) were transduced into Huh7 cells. None-transduced Huh7 cells are included as control (Mock). The media was changed to fresh DMEM media 24h later. After another 24h, part of the cells was collected to check the knockdown efficiency of shRNAs (left and middle panel), the same time, equal number of 1×10⁶ cells were transferred to six-well plates and then treated with IFNα (200U/ml) to induce the expression of IFITM3. Twenty-four hours after IFNα treatment. The cells were infected with Zika virus at MOI = 1 and were then collected at 72h post-infection for qPCR to detect the NS5 levels of Zika virus (right pannel). All data are representative of more than three independent experiments, and are shown by the mean value with +s.d. ns, p >0.05; *, p <0.05; **, p <0.01; ***, p <0.001.

