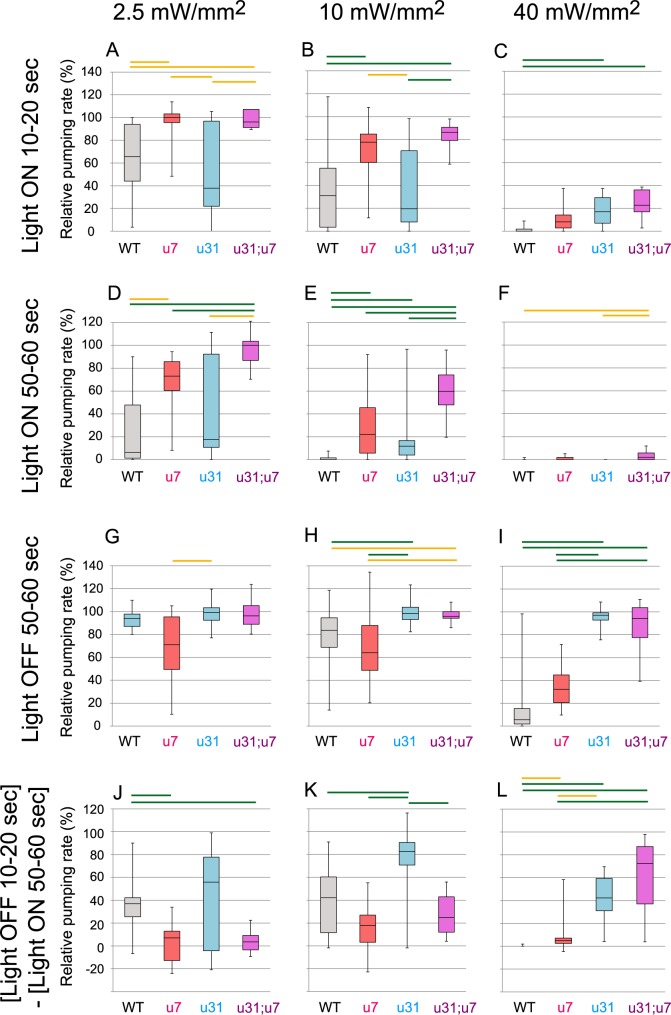
Fig 4. Comparison of modulation of the pumping rate among mutant animals carrying ncIs53(myo-3p::Arch::gfp, rig-3p::mCherry).
A box-whisker plot of the relative pumping rate during the 10 s period of WT, unc-7(e5), unc-31(e928), and unc-31(e928); unc-7(e5) animals shown in Fig 3. The boxes include 50% of the data. The inner line marks the median value, and whisker lines extending from the box represent the minimum and maximum values. The pumping rate during the 10 s period immediately before illumination was initiated was set as the standard for each animal. The relative pumping rate during the 10 s period between 10 and 20 s after illumination was initiated (A-C: Light ON 10–20 s), between 50 and 60 s after illumination was initiated (D-F: Light ON 50–60 s), and the 10 s period between 50 and 60 s after illumination was terminated (G-I: Light OFF 50–60 s) is shown. As a measure of a post-illumination recovery, the change between the relative pumping rate during the 10 s period between 10 and 20 s after illumination was turned off (light OFF 10–20 s), and the rate immediately before illumination was turned off (light ON 50–60 s) was also determined. J-L: (Light OFF 10–20 s)–(Light ON 50–60 s) for each animal. u7, u31, and u31;u7 indicates unc-7(e5), unc-31(e928), and unc-31(e928); unc-7(e5) animals, respectively. Green and yellow bars above the plots show the statistical significances of difference among strains determined by the Kruskal-Wallis test with post-hoc Steel-Dwass multiple comparison test (p < 0.01 and p < 0.05, respectively).

