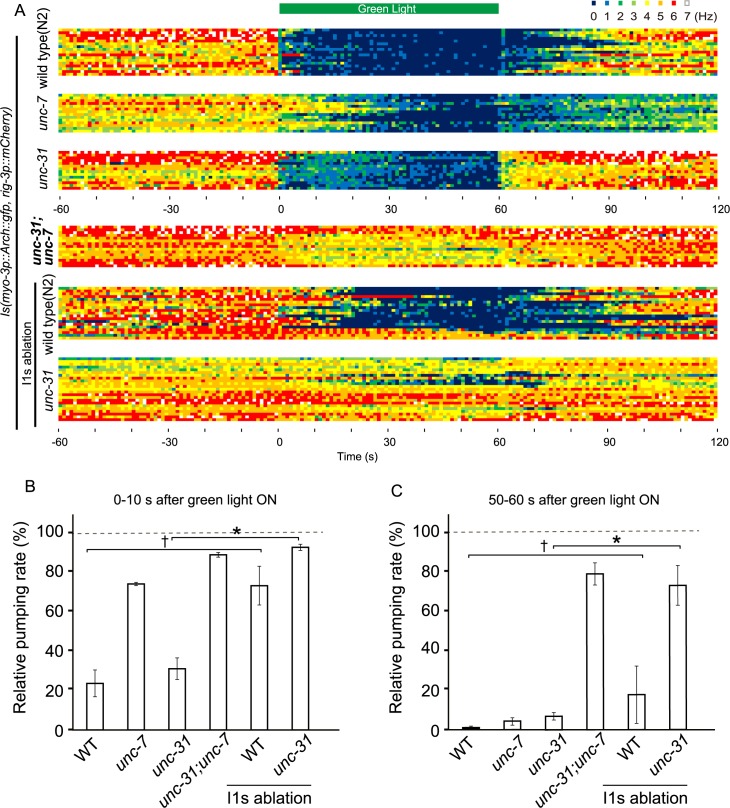
Fig 5. Effects of ablation of I1 neurons on modulation of the pumping rate by green light illumination at low intensity (A) The frequency of pumping before, during, and after light illumination (5.5 mW/mm2) represented by the heat map.
Dark blue indicates no pumping, and red indicates six pumps/s as shown on the upper right. Each row indicates one trial. The time courses of the modulation of pumping in WT (N2), unc-7(e5) mutant, unc-31(e928) mutant, and unc-31;unc-7 double mutant animals are shown. unc-31;unc-7 double mutant animals continued pumping throughout the 1 min period of illumination. WT animals, in which the I1 neurons were ablated, exhibited a similar pattern of modulation to that in unc-7 mutants. The pumping rate in unc-31 animals in which the I1 neurons were ablated did not decrease during illumination, and was similar to that in unc-31;unc-7 double mutants. WT (N2): n = 3 worms, 17 trials; unc-7: n = 3 worms, 14 trials; unc-31: n = 3 worms, 15 trials; unc-31;unc-7: n = 3 worms, 15 trials; WT (N2), I1 ablation: n = 4 worms, 19 trials; unc-31, I1 ablation: n = 5 worms, 23 trials. (B) Relative pumping rate during the 10 s period after illumination was started as calculated from the data shown in (A). The pumping rate during the 10 s period immediately before illumination with green light was used for normalization. The statistical significances of the difference among strains were determined by the Mann-Whitney U test (*:p < 0.05; †: p < 0.1). (C) Relative pumping rate during the 10 s period immediately before illumination was stopped as calculated from the data shown in (A). The pumping rate during the 10 s period immediately before illumination was set as the standard. The statistical significances of the difference among strains were determined by the Mann-Whitney U test. (*:p < 0.05; †: p < 0.1).

