
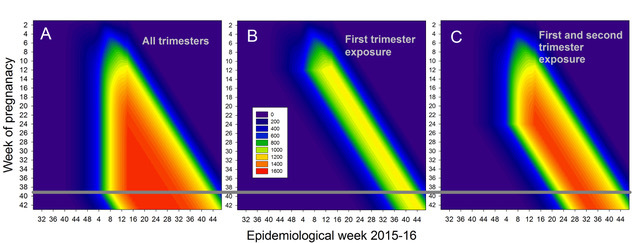
Fig. 7: Pregnancies during a particular week (vertical axis) present during a particular epidemiological week (horizontal axis). (A) Total number of pregnancies, (B) the number of pregnancies exposed in the first trimester, and (C) the number of pregnancies exposed in either the first or second trimester. A uniform exposure by week of pregnancy is assumed. The number of births in each category is approximately the number that crosses the 39/40 week boundary (horizontal black line), but it is more accurately given by weighting them according to the distribution of births from week 35 through 43.