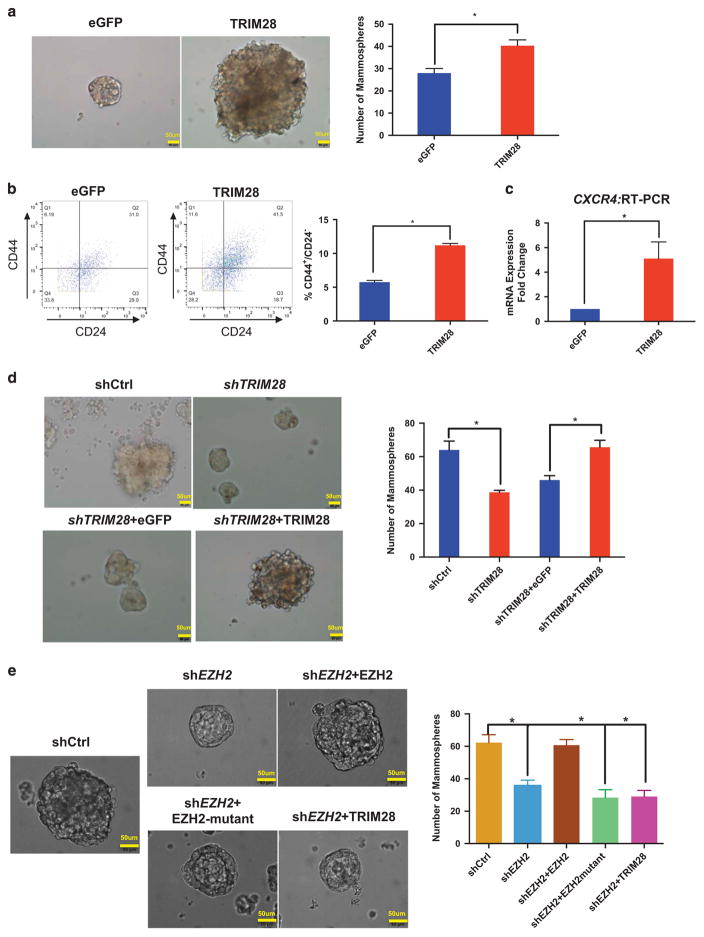
Figure 5.
TRIM28 promotes mammosphere formation. (a) Brightfield images showing that mammosphere formation ability of MCF7 cells is increased by ectopic expression of TRIM28. Bar graphs are average sphere numbers ±s.e.m. per 2 × 10³ plated cells from three independent experiments (*P<0.05). Mammopheres of size >60 μm were counted. (b) CD44+/CD24− populations analyzed by mass cytometry of control eGFP- and ectopic TRIM28-expressing MCF7 cells with quantified results shown in the graph. Error bars represent s.e.m. from three independent experiments: Number of events counted were 3838, 3082 and 2668 for TRIM28 overexpression; and 2453, 1697 and 2078 for eGFP control, respectively (*P<0.05). (c) CXCR4 expression analyzed by RT-qPCR in mammospheres of MCF7 cells overexpressing TRIM28. Error bars represent s.e.m. from three independent experiments (*P<0.05). (d) Brightfield images of mammospheres in TRIM28-depleted MCF7 cells ectopically expressing eGFP or shRNA-resistant TRIM28. Bar graphs are average sphere numbers ±s.e.m. per 2 × 10³ plated cells from three independent experiments (*P<0.05). Mammopheres of size >60 μm were counted. (e) Brightfield images of mammospheres in EZH2-depleted MCF7 cells ectopically expressing TRIM28 or shRNA-resistant wild type or mutant EZH2. Bar graphs are average sphere numbers ±s.e.m. per 2 × 10³ plated cells from three independent experiments (*P<0.05). Mammopheres of size >60 μm were counted.

