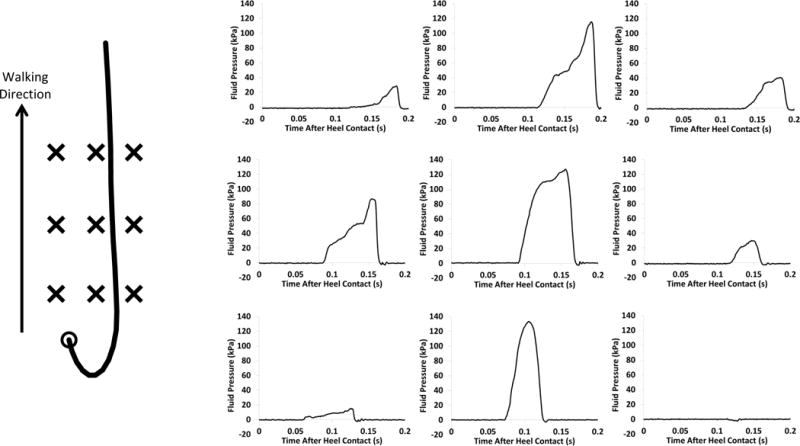
Figure 2.

Representative heel trajectory (left) and time-series fluid pressures (right) during a single subject’s unexpected slip with untreaded shoes. The thick solid line represents the heel trajectory, the circle is the location of the heel at heel contact and each of the fluid pressure sensors is marked with an X. The fluid pressure graphs are positioned according to their location in the pressure sensor array (i.e., the top left graph corresponds to the top left sensor).
