. 2018 Jan 9;7:e29747. doi: 10.7554/eLife.29747

Figure 2. Olaparib sensitivity in cells transformed with the EWS-FLI1 rearrangement.

Cell viability assays were performed for EWS-FLI1 and FUS-CHOP transformed mouse mesenchymal cells, as well as the human Ewing’s sarcoma cell line (SK-N-MC), which harbors the EWS-FLI1 fusion. Cells were treated with the indicated doses of olaparib and 72 hr later cell viability was determined. Relative viability was calculated as a percentage of vehicle control treated cells. Means reported and error bars represent SD from three independent biological repeats. Additional details for this experiment can be found at https://osf.io/t3dm6/.

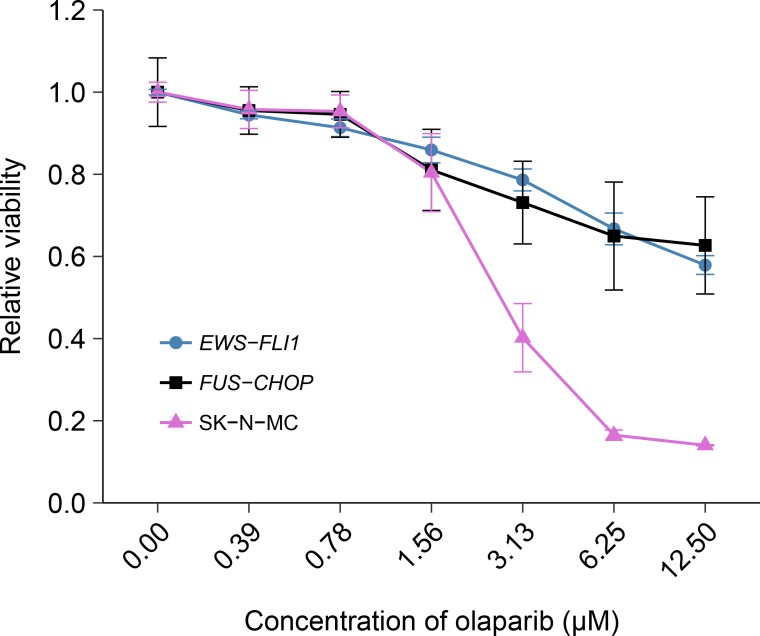
Figure 2.

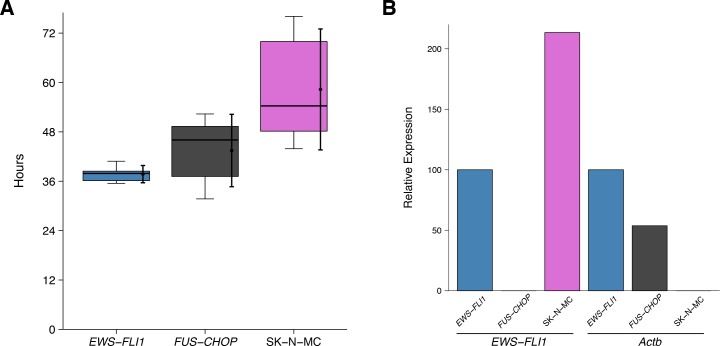
Figure 2—figure supplement 1. Population doubling time of cells and confirmation of EWS-FLI1 rearrangement.

Figure 2—figure supplement 1.

(A) For each cell line, relative viability of untreated and vehicle control treated cells at 24 and 72 hr after treatment with olaparib were used to determine the population doubling times. Box and whisker plot with median represented as the line through the box and whiskers representing values within 1.5 IQR of the first and third quartile. Means as black dot and bold error bars represent 95% CI (n = 6). (B) Relative expression levels of EWS-FLI1 and Actb were determined by qRT-PCR for each cell line. Expression level of EWS-FLI1 transformed mouse mesenchymal cells was assigned a value of 100. Means reported from one biological repeat. Actb, a housekeeping gene for the mouse mesenchymal cells, was not expected to be expressed in SK-N-MC cells, which are human. The EWS-FLI1 transformed mouse mesenchymal cells contain the EWS-FLI1 fusion gene from SK-N-MC cells (Riggi et al., 2005). Additional details for this experiment can be found at https://osf.io/t3dm6/.