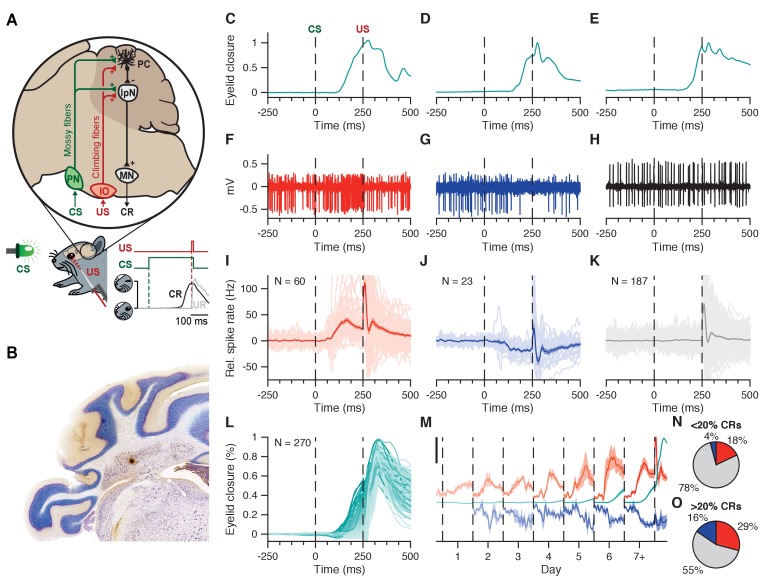
Figure 1. Interpositus nucleus electrophysiology overview.
(A) CS and US signals are transmitted through mossy fibers and climbing fibers, respectively, to Purkinje cells in the simplex lobule (HVI) of the cerebellar cortex, and to the IpN, to which cortical Purkinje cells send their inhibitory projection. Combined disinhibition and excitation then lead the IpN to drive CRs. Paired trials consisted of a 260 ms LED light CS, co-terminating with a 10 ms corneal air puff. (B) Coronal cerebellar section showing a typical recording site in the IpN. C-E Example eyelid traces for trials where the recorded cell showed spike facilitation (C), suppression (D), or no modulation (E) in the CS-US interval. (F-H) Electrophysiological trace showing IpN activity corresponding to the example eyelid traces in (C-E). (I) Spike trace averages for 60 cells from the first dataset showing at least 5 Hz facilitation in the CS-US interval; grand average is shown with SEM. (J) Same as in I, but for 23 suppressive cells. (K) Same as in I, but for 187 non-modulating cells. (L) Average traces of eyelid behavior for all 270 cells in the first dataset, color coded for average CR amplitude at US onset. (M) Daily CS-US interval averages of facilitatory cells (top traces, orange), suppressive cells (bottom traces, blue), and eyelid behavior for all cells showing modulation (middle traces, teal). Black scale bar denotes 25 Hz/% eyelid closure. (N, O) Proportion of cells showing facilitation, suppression, or no modulation, across cells with <20% CRs (n = 167), and cells with >20% CRs (n = 103). IpN: interpositus nucleus; IO: inferior olive; MN: motor nucleus; PC: Purkinje cell; PN: pontine nuclei.


