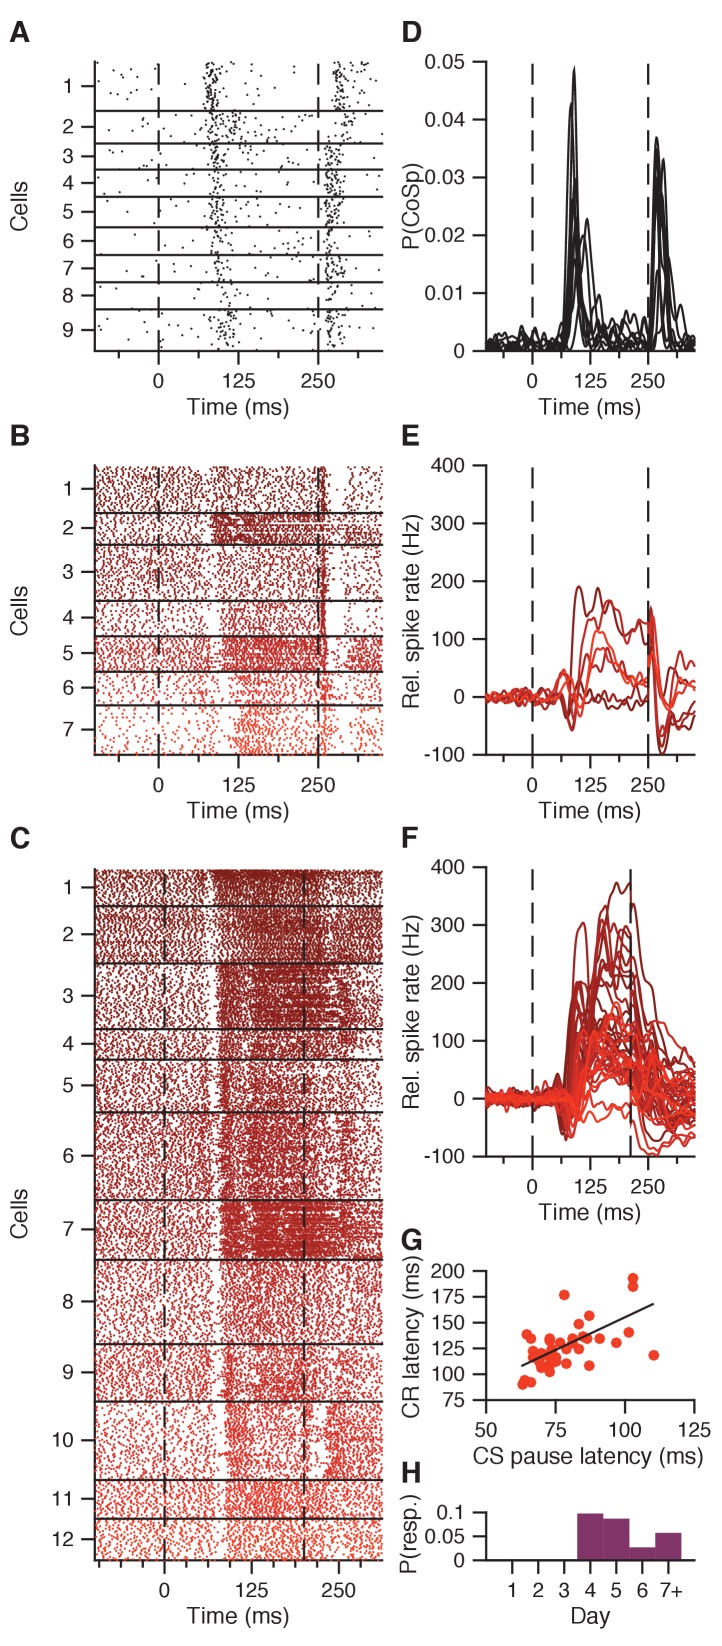
Figure 4. CS pause response reflecting CS-related Purkinje cell complex spike.
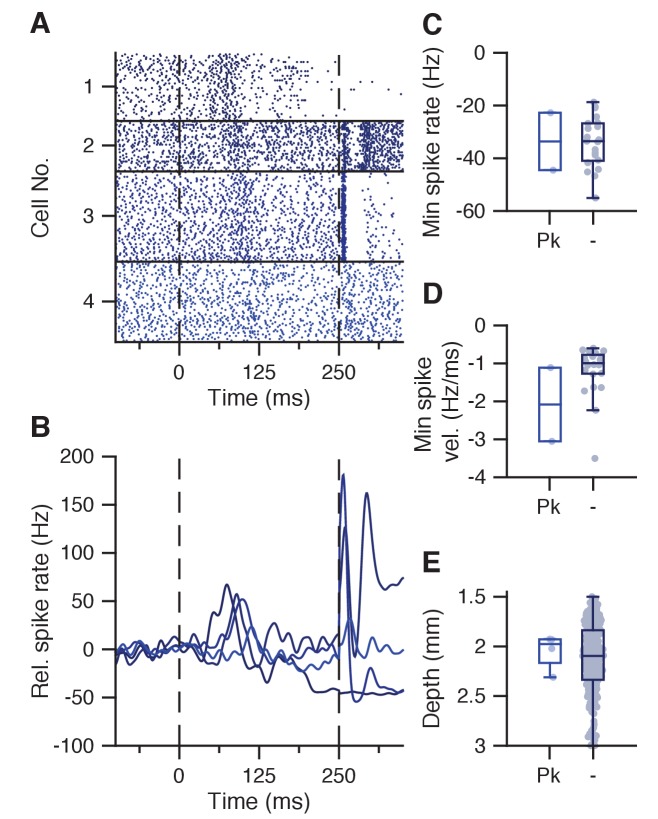
(A) Combined complex spike raster plot for 9 Purkinje cells ordered by the latency of their clear CS-related complex spike response in addition to the US-related complex spike (data from ten Brinke et al., 2015). (B) Combined raster plot for 7 IpN neurons, ordered by the latency of their CS pause in spike activity. (C) Same as in B, but for 12 of the 41 IpN neurons in the second dataset that showed a CS pause. (D-F) Average spike traces corresponding to the cells shown in (A-C), with (D) showing the probability of a complex spike instead of relative spike rate. (G) CS pause latency plotted against the latency at which the CR passes 5% eyelid closure, for all 45 cells showing both properties across the original and the second dataset. (H) Probability across days of finding a transient spike response at CS-complex spike latency, inhibitory (this figure) or excitatory (Figure 4—figure supplement 1), in the first dataset.


