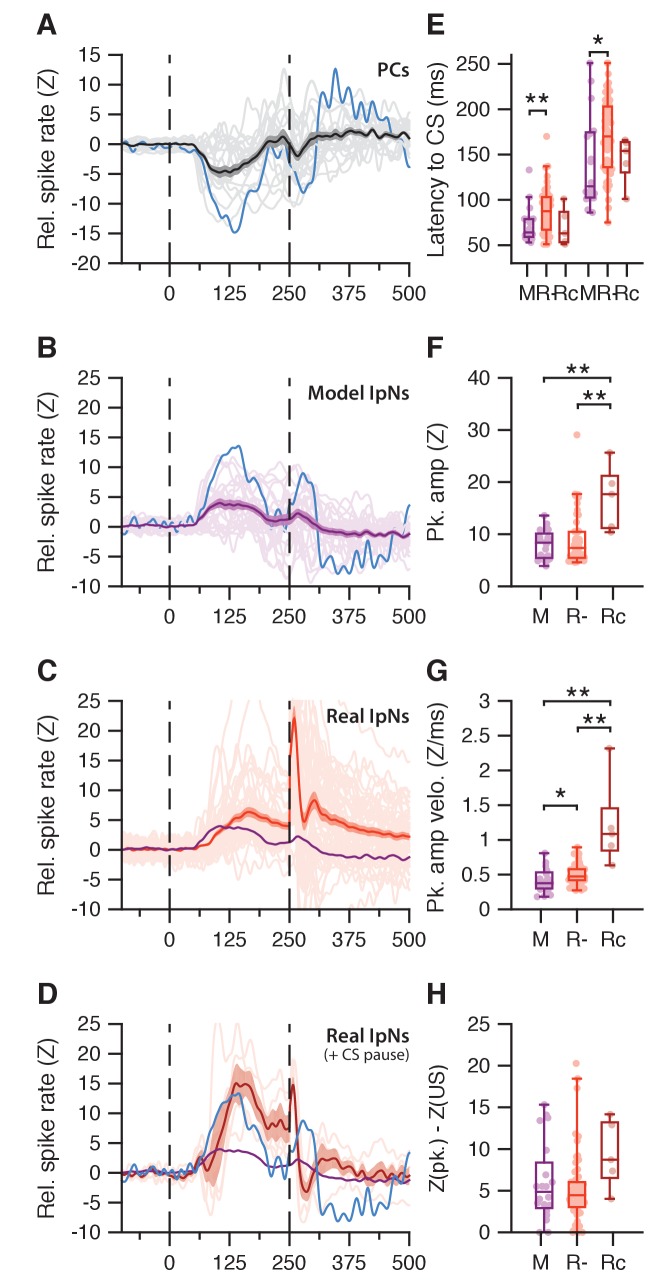
(A) Average simple spike traces (light gray) in eyelid-related Purkinje cells that showed conditioned suppression; grand average is shown in black, with SEM. Blue trace shows the Purkinje cell with the deepest suppression. (B) Average traces of modeled IpN activity, with each cell containing 30 trials based on a simple spike suppression profile from the dataset in A. Blue trace shows the modeled IpN activity corresponding to the blue Purkinje cell trace in A. (C) Average traces of actual recordings of facilitation cells that did not show a CS pause. Purple trace denotes the average of the modeled IpN neurons in B. (D) Same as in C, here showing facilitation cells that did show a CS pause. Blue trace is the same as in B. (E) Timing of modeled (M) IpN facilitation, compared to that of real IpN neurons that did not (R-) or did (Rc) show a CS pause. The first three bars denote facilitation onset times, and the second set of bars shows peak time. The modeled IpN neurons seem to align particularly with the earlier facilitation profiles of the non-CS pause cells in terms of both onset (M: 73 ± 19 ms; R-: 88 ± 25 ms, p=0.0098, MWU) and peak times (M: 144 ± 55 vs R-: 171 ± 43 ms, p=0.0221, MWU). (F) Facilitation peak amplitude was higher in CS pause cells (Rc, 17 ± 6.3) than both modeled IpN neurons (M, 8 ± 2.8, p=0.0039, MWU) and non-CS pause cells (R-, 9.3 ± 6, p=0.0064, MWU). (G) Whereas R- cells showed slightly higher spike rate velocities than M cells (0.5 ± 0.1 vs. 0.4 ± 0.2 z/ms, 0.0198, MWU), Rc cells showed particularly high velocities (1.2 ± 0.6 z/ms) compared to both R- (p=0.0006, MWU) and M cells (p=0.0013, MWU). (H) The drop in amplitude from peak to US onset was significantly great for Rc cells compared to R- cells (9.4 ± 4.1 vs 5.3 ± 4.3, p=0.0283, MWU), but the comparison with M cells (6 ± 4.8, p=0.11, MWU) failed to reach significance.


