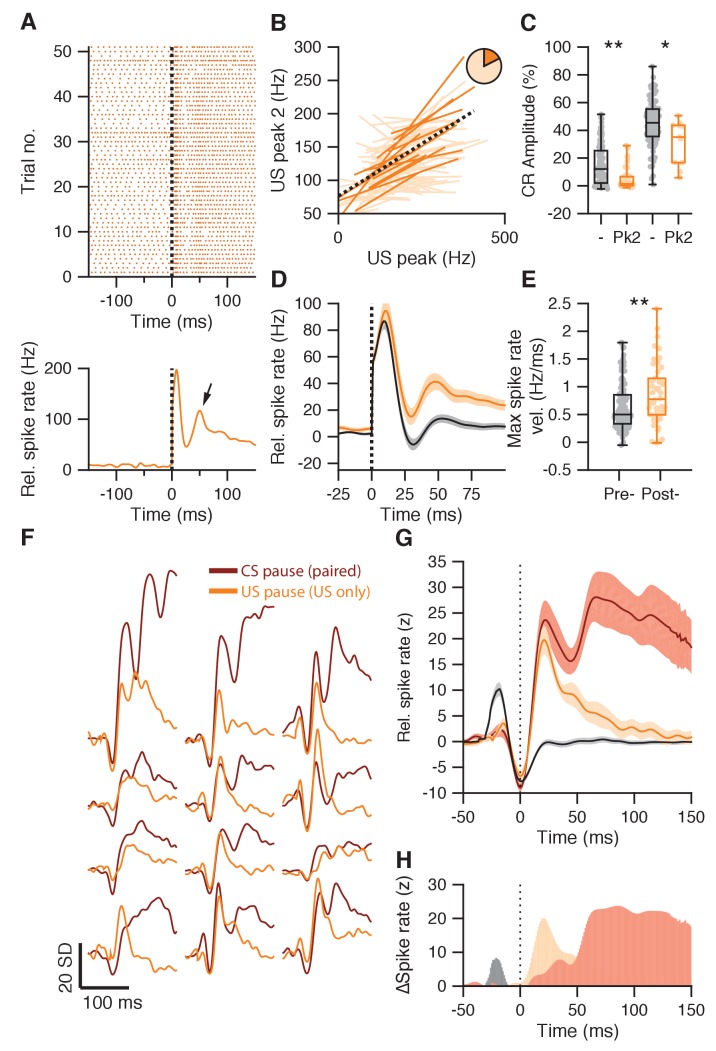
Figure 7. Second US peak response akin to rapid post-CS pause excitation.
(A) Raster plot (upper panel) and average spike trace (lower panel) of an example IpN cell showing a second US peak (arrow). (B) Significant (plain orange) and non-significant (light orange) trial-by-trial correlation lines for cells showing both a first and a second US peak (n = 83). Pie chart shows the proportion of significant cells, black dotted line shows fit from a linear mixed model, integrating significant cells. (C) IpNs with a second US peak (Pk2) show lower average CR amplitudes at US onset than IpNs without (-), in both the first dataset (left boxplot pair; p<0.0001), as well as in the second dataset (right boxplot pair; p=0.021). (D) Average traces with SEM of spike activity relative to baseline for IpNs recorded without conditioned behavior on days 1–4 (black), and those recorded without conditioned behavior after day 4 (yellow). (E) Maximum spike rate velocity of the second US peak was significantly higher in recordings without CR behavior on day five and over (post-) compared to earlier recordings without behavior (pre-; p=0.0072). (F) Average spike traces of paired trials, aligned by CS pause minima (brown), and of US-only trials from the corresponding IpN cell, aligned by US pause (yellow) minima, for 12 recordings from the second dataset. The traces were standardized by the activity −150 to −50 ms relative to the pause minima. (G) Averages of the CS pause (brown) and US pause (yellow) traces in F, with SEM. For reference, US pause-aligned traces from paired trials of IpNs from the first dataset, with US pauses, without CR behavior, and from day 1–4, are shown in black. (H) The difference between US-responses in US-only trials after training (yellow) and US-responses in paired trials early in training before CR behavior is acquired (gray) highlight the absence of the first US peak and the substantial presence of a second peak after the US pause, in well-trained animals. Additionally, the difference between the CS pause-aligned traces from paired trials (brown) and the US-pause aligned traces from US-only trials of the same IpN set (yellow) suggests the two profiles only start to diverge substantially approx. 50 ms after the pause response.


