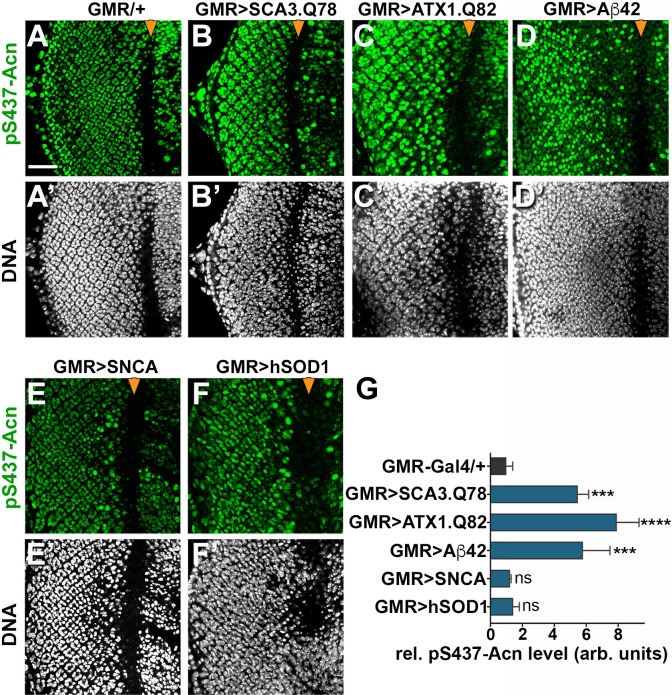
Figure 9. Increased Acn-S437 phosphorylation is specific for a subset of neurodegeneration models.
Projections of confocal micrographs of eye discs stained for pS437-Acn (A–F) or DNA (A’–F’). Compared to GMR-Gal4 controls (A), eye discs with GMR-Gal4-driven UAS-SCA3.Q78 (B) or UAS-ATX1.Q82 (C) or UAS-Aβ42 (D) display elevated levels of pS437-Acn staining in a subset of cells, in contrast to UAS-alpha-Synuclein (E) or UAS-hSOD1 (F) which appear unaltered compared to controls. GMR-directed expression of transgenes initiates at the furrow (arrowhead) and extends toward the posterior (left). Scale bar in A is 40 µm in A-N. Detailed genotypes are listed in Supplementary file 3. (G) Quantifications of S437 phosphorylation averaged constant areas containing about 50 ommatidial clusters located at least 6–8 rows posterior to the furrow. Bar graphs show mean ±SD of integrated densities of pS437 staining normalized to GMR-Gal4 controls. ns, not significant; **p<0.01; ***p<0.001; ***p<0.0001; compared to GMR-Gal4/+.

