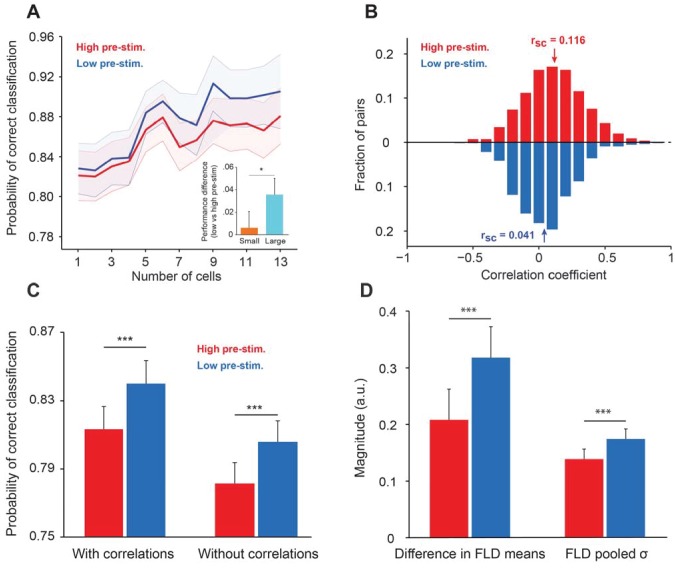
Figure 5. Cortical state influences the information encoded in population activity.
(A) The probability of correct classification (PCC) as a function of population size. PCC was significantly higher in the low pre-stimulus case (F(1,164)=9.32; p<0.005; two-way repeated measures ANOVA). (inset) The difference in classification performance between low and high pre-stimulus response states for a small (n = 2, orange) and a large population (n = 12, blue). The performance difference was greater for the larger neural population (p<0.05, bootstrap test). (B) Noise correlations of evoked responses for the high and low pre-stimulus states – correlations were significantly higher in the high pre-stimulus state (p=7.918e-10; paired t-test). (C) Probability of correct classification for the two cortical states. ‘With correlations’ represents data using the following equation: ; Probability of correct classification = . ‘Without correlations’ represents the probability of correct classification when ignoring the effect of noise correlations using (), where is the diagonal covariance matrix. In each condition there is a statistically significant difference between the high and low pre-stimulus conditions (*p<0.05; paired t-test). (D) The magnitude of the difference in FLD means (left) and the magnitude of the pooled standard deviation () of the FLD (right). In the low pre-stimulus condition, the difference in means was significantly greater (p<0.0001; paired t-test). The average variance was also higher in the low pre-stimulus condition (p<0.0001; paired t-test), but this had less overall impact on the population d’. The results in this figure were obtained for all the cells recorded across sessions for an orientation difference of ±5°.


