. 2018 Jan 9;7:e27166. doi: 10.7554/eLife.27166

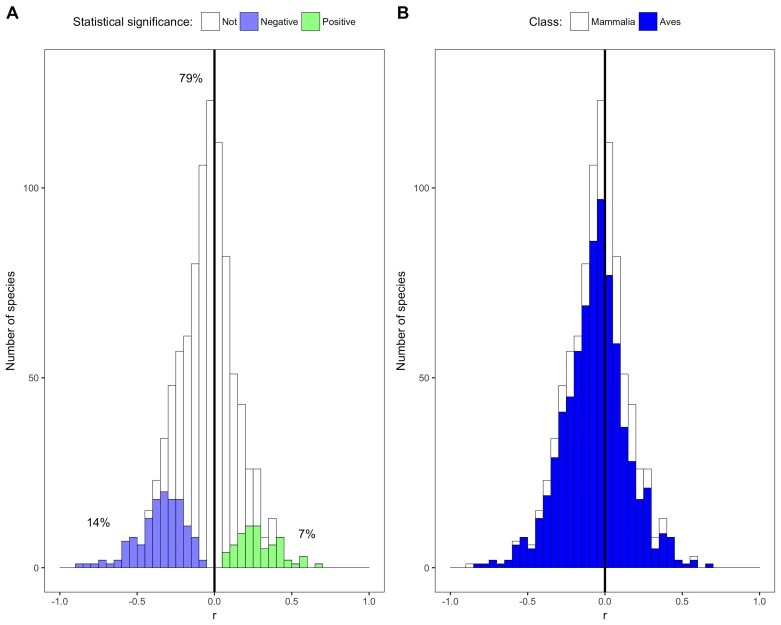
Figure 2. Species correlation coefficients by statistical significance and taxonomic class.

(A) Stacked histogram of correlation coefficients (r) for all species' intraspecific temperature-mass relationships. Colored bars show species with statistically significant relationships, both negative (purple) and positive (green), while white bars indicate species with relationship slopes that are not significantly different from zero. Percentages are of species in each group. (B) Stacked histogram of all species' correlation coefficients with bar color corresponding to taxonomic class. Dark vertical lines are correlation coefficients of zero. See Figure 2—figure supplements 16.

Figure 2.

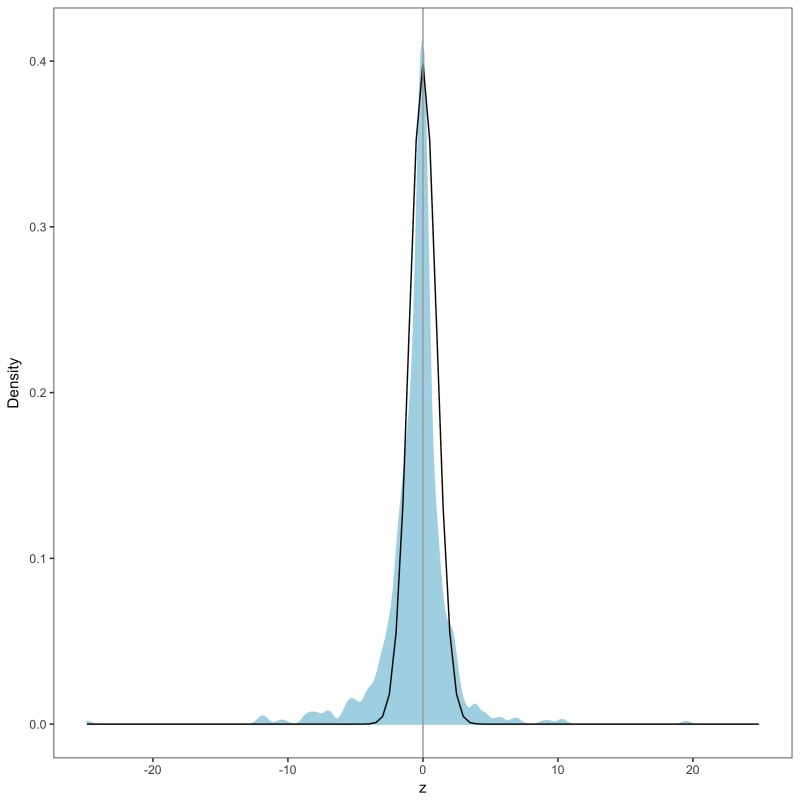
Figure 2—figure supplement 1. Species z scores and z distribution.

Figure 2—figure supplement 1.

Density plot of z scores for all species’ intraspecific temperature-mass relationships in blue, with standard normal z distribution shown with black line. Z scores were calculated from p-values corrected with false discovery rate control. Grey vertical line is z score of zero.

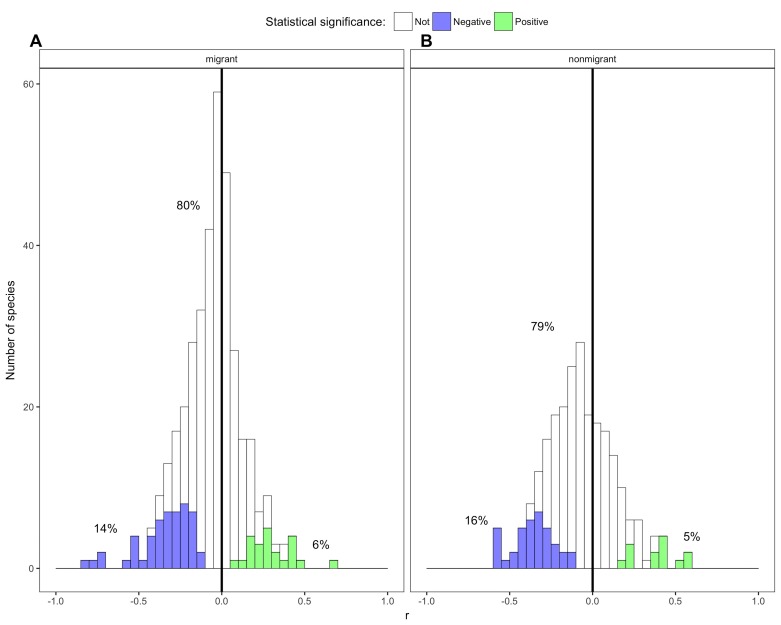
Figure 2—figure supplement 2. Species correlation coefficients by bird migratory status.

Figure 2—figure supplement 2.

Stacked histograms of correlation coefficients (r) from intraspecific temperature-mass relationships for (A) migrant and (B) nonmigrant bird species. Of 750 bird species, 371 migrant species and 243 nonmigrant species were identified from data requested from BirdLife International (Birdlife International, 2017); species with migratory status codes of ‘Altitudinal Migrant’, ‘Full Migrant’, and ‘Nomadic’ were reclassified as migrants and ‘Not a Migrant’ as nonmigrants. Colored bars show species with statistically significant relationships, both negative (purple) and positive (green), while white bars indicate species with relationship slopes that are not significantly different from zero. Percentages are of species in each group. Dark vertical lines are correlation coefficients of zero.

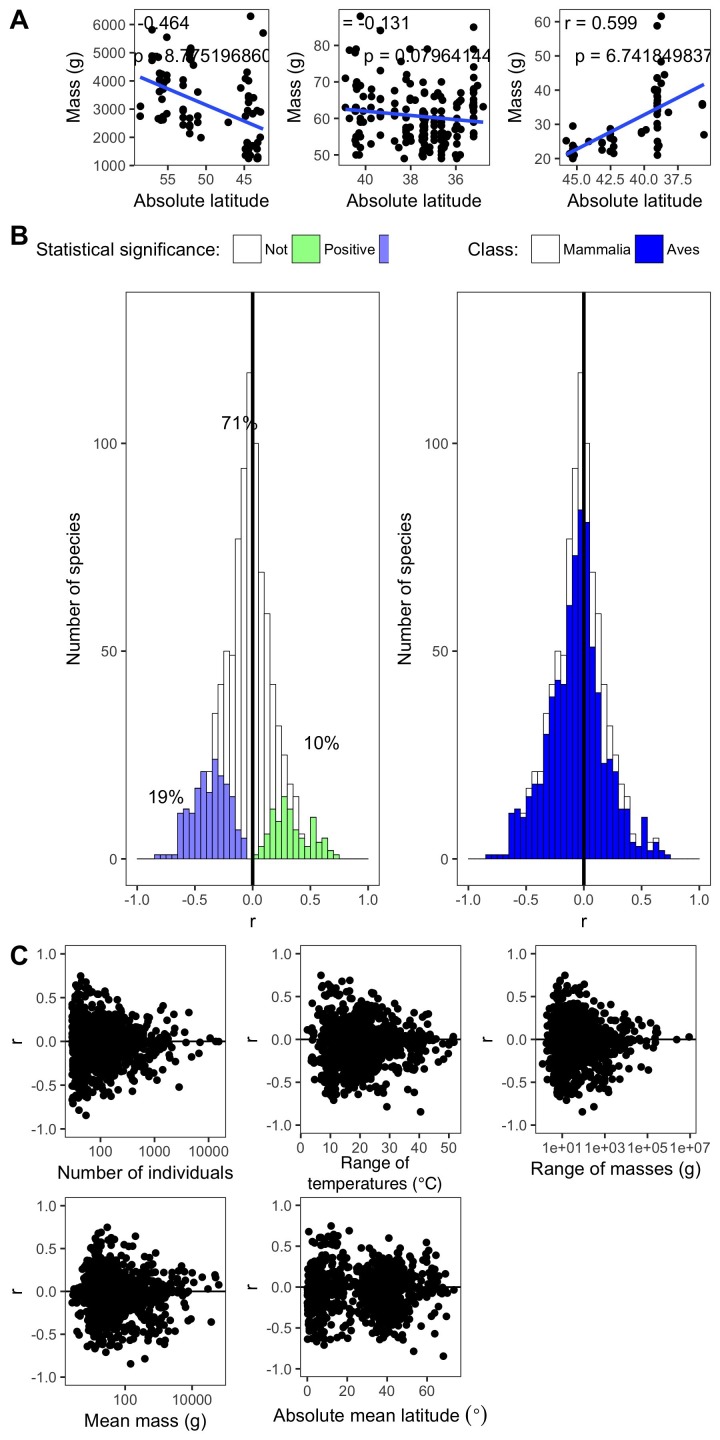
Figure 2—figure supplement 3. Species correlation coefficients for latitude-mass relationships.

Figure 2—figure supplement 3.

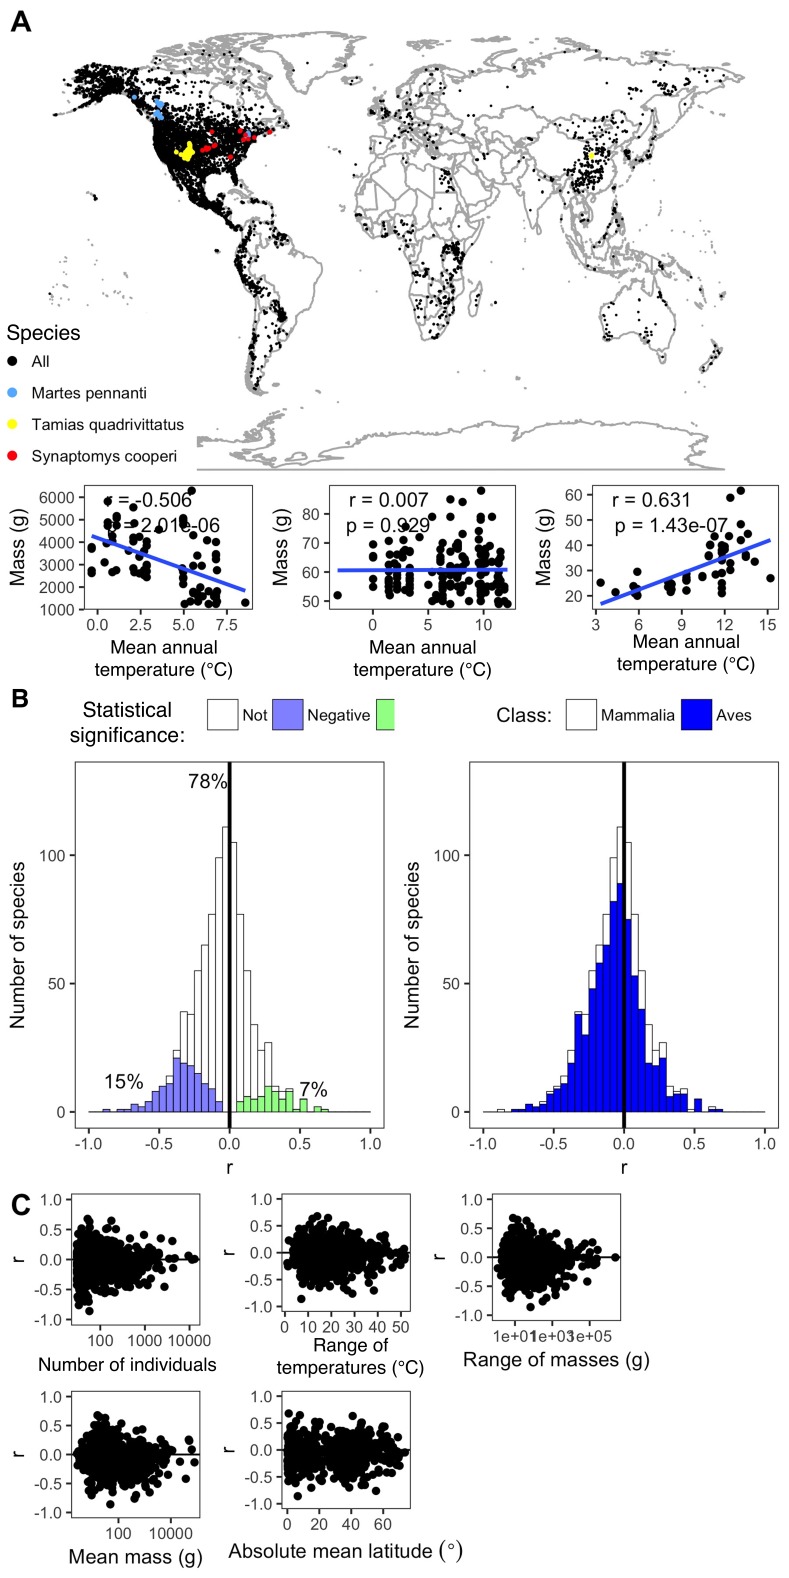
Results for all species' latitude-mass relationships including (A) linear regression for latitude-temperature relationships for three example species, Martes pennanti, Tamias quadrivittatus, and Synaptomys cooperi, (B) stacked histograms of all species' correlation coefficients (r) showing statistical significance of relationships and relationships by taxonomic class, and (C) variation in all species' correlation coefficients across number of individuals, collection year temperature range, mass range, mean mass, and absolute mean latitude. The latitude axes in (A) are reversed (i.e., higher latitudes to left) to correspond with temperature axes (Figures 1 and 2).

Figure 2—figure supplement 4. Species correlation coefficients for temperature-mass relationships with lifestage sensitivity analysis.

Figure 2—figure supplement 4.

Results for all species' temperature-mass relationships with additional filtering of specimens based on lifestage. The final dataset (Figure 2A) contained a column with lifestage information for each individual, if it had been recorded. To remove all individuals explicitly identified as non-adults, we filtered that dataset to include only those individuals which had their lifestage recorded as adult, or if no lifestage information was provided. These include (A) spatial collection locations of all individual specimens and linear regression for temperature-mass relationships for three example species, Martes pennanti, Tamias quadrivittatus, and Synaptomys cooperi, (B) stacked histograms of all species' correlation coefficients (r) showing statistical significance of relationships and relationships by taxonomic class, and (C) variation in all species' correlation coefficients across number of individuals, collection year temperature range, mass range, mean mass, and absolute mean latitude.

Figure 2—figure supplement 5. Species correlation coefficients for temperature-mass relationships with outlier sensitivity analysis.

Figure 2—figure supplement 5.

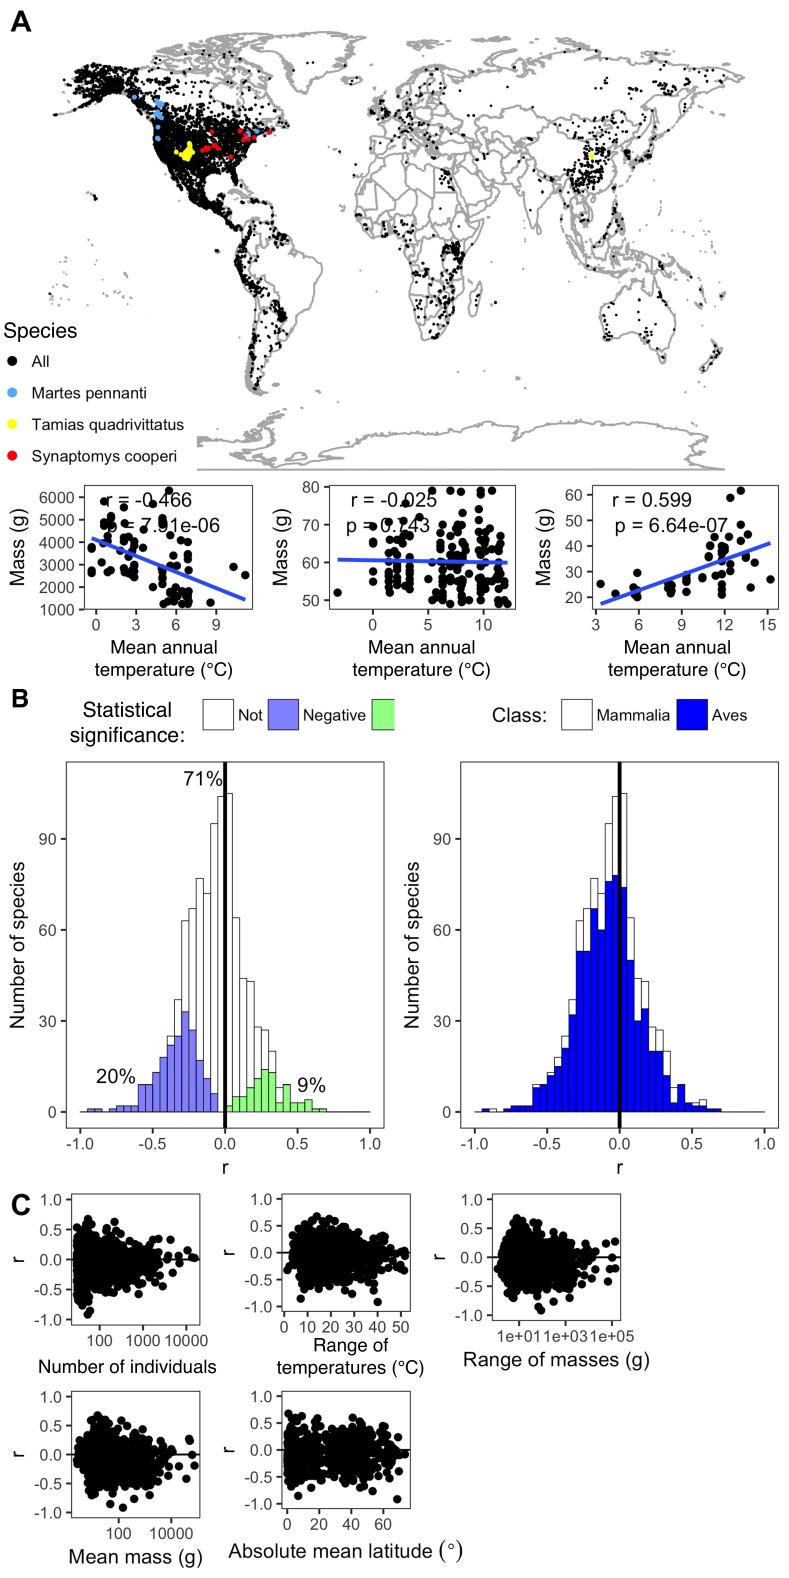
Results for all species' temperature-mass relationships with outliers removed. Outliers were considered any individual mass value that was more than three standard deviations away from the fitted relationship value. These include (A) spatial collection locations for all individual specimens and linear regression for temperature-mass relationships for three example species, Martes pennanti, Tamias quadrivittatus, and Synaptomys cooperi, (B) stacked histograms of all species' correlation coefficients (r) showing statistical significance of relationships and relationships by taxonomic class, and (C) variation in all species' correlation coefficients across number of individuals, collection year temperature range, mass range, mean mass, and absolute mean latitude.

Figure 2—figure supplement 6. Species correlation coefficients for temperature-mass relationships with species thresholds increased.

Figure 2—figure supplement 6.

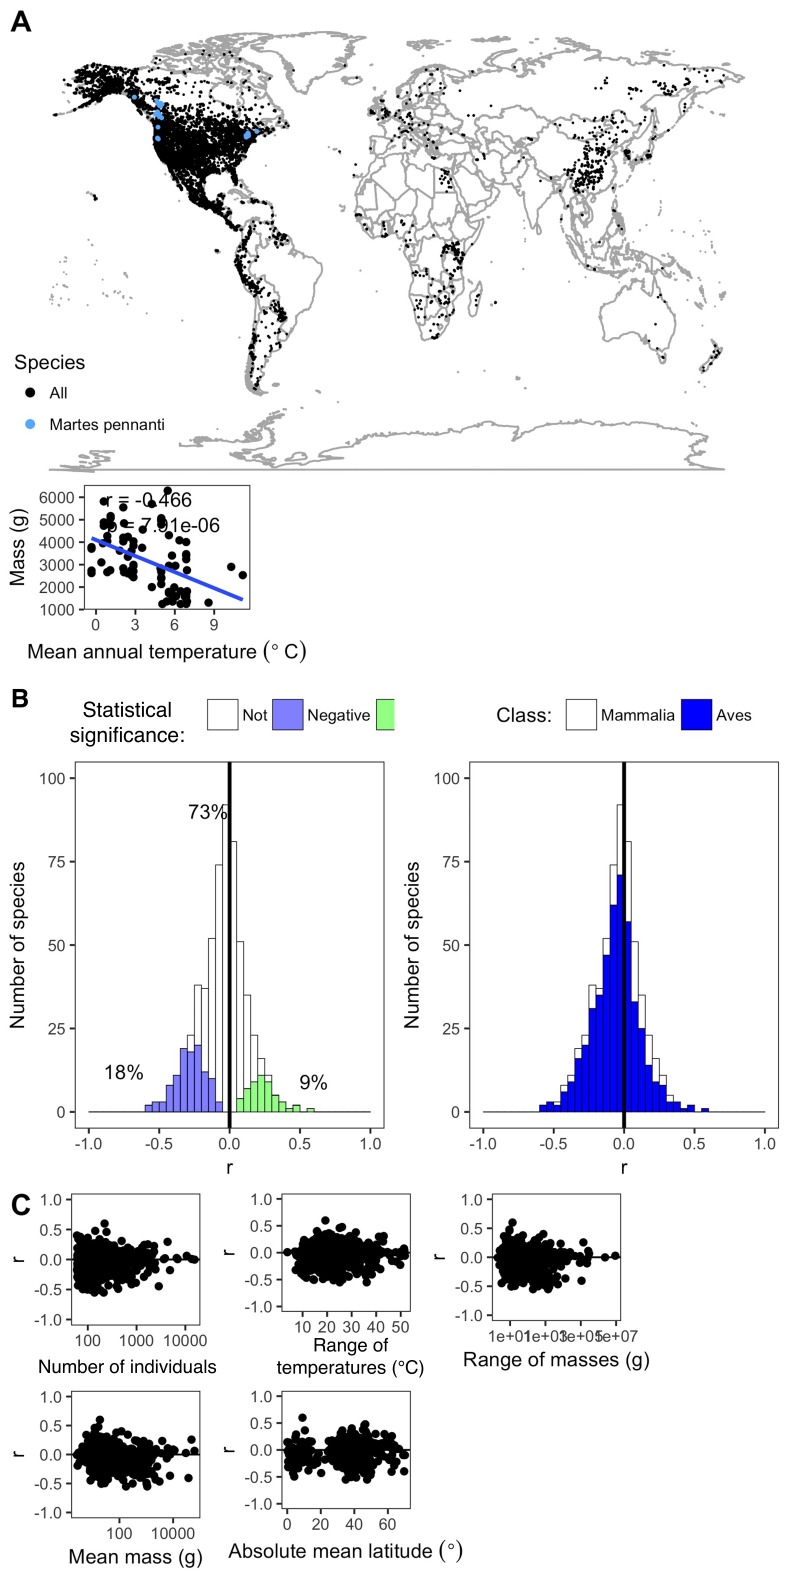
Results for all species’ temperature-mass relationships for species with at least 60 individuals, range in collection years of at least 40, and range in latitudinal degrees of at least 10 (n = 591). These include (A) spatial collection locations for all individual specimens and linear regression for temperature-mass relationship for an example species, Martes pennant, (B) stacked histograms of all species’ correlation coefficients (r) showing statistical significance of relationships and relationships by taxonomic class, and (C) variation in all species’ correlation coefficients across number of individuals, collection year temperature range, mass range, mean mass, and absolute mean latitude.

Figure 2—figure supplement 7. Species correlation coefficients for temperature-mass relationships with species thresholds decreased.

Figure 2—figure supplement 7.

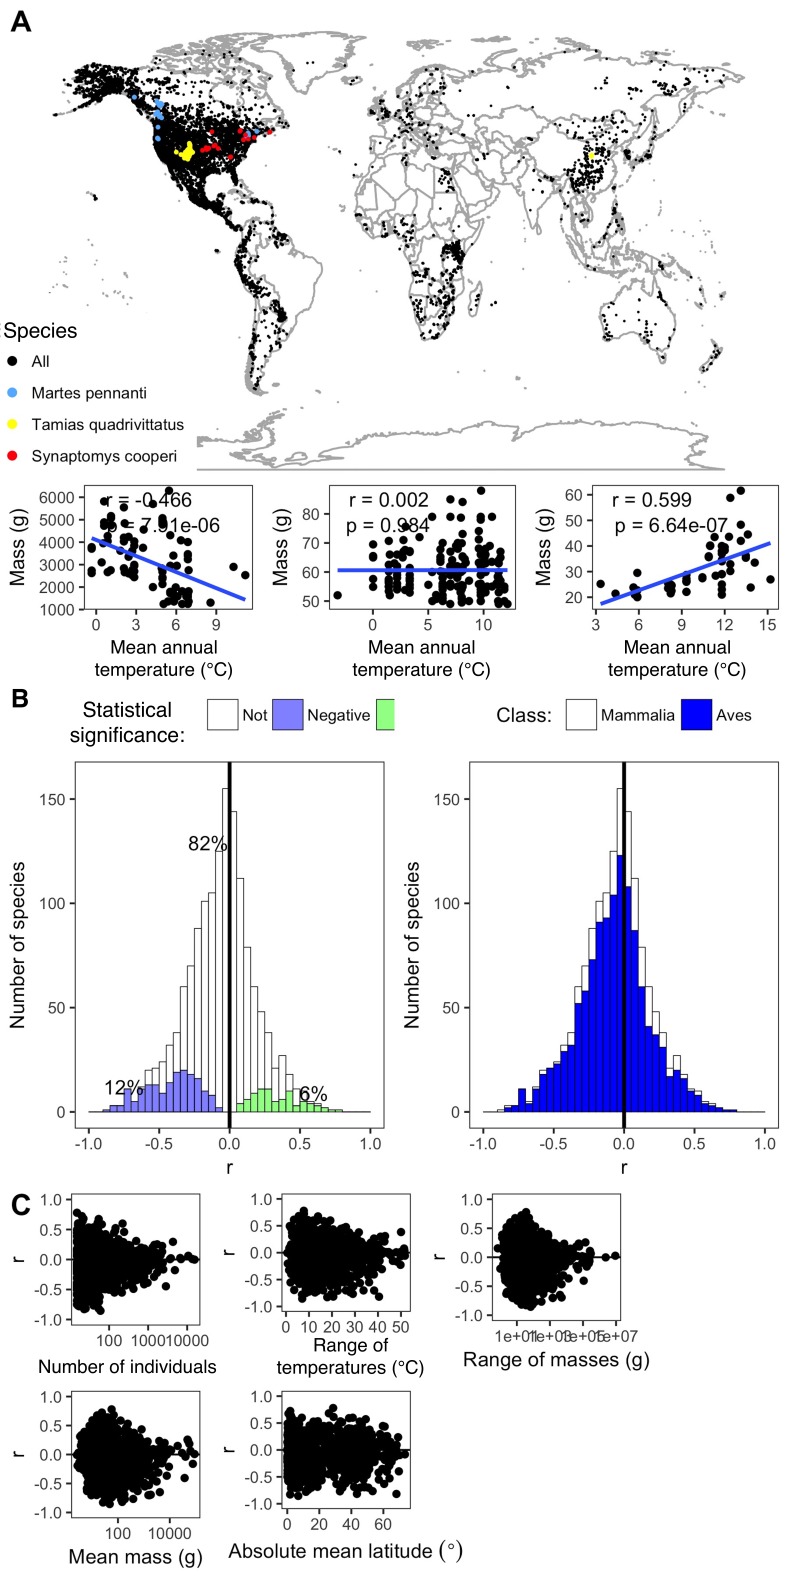
Results for all species’ temperature-mass relationships for species with at least 15 individuals, range in collection years of at least 10, and range in latitudinal degrees of at least 2.5 (n = 1,455). These include (A) spatial collection locations for all individual specimens and linear regression for temperature-mass relationships for three example species, Martes pennant, Tamias quadrivittatus, and Synaptomys cooperi, (B) stacked histograms of all species’ correlation coefficients (r) showing statistical significance of relationships and relationships by taxonomic class, and (C) variation in all species’ correlation coefficients across number of individuals, collection year temperature range, mass range, mean mass, and absolute mean latitude.