. 2018 Jan 9;7:e27166. doi: 10.7554/eLife.27166

Figure 4. Species correlation coefficients with selected past year temperatures.

Histograms of correlation coefficients (r) for all species' intraspecific temperature-mass relationships with mean annual temperature from (A) the year in which individuals were collected, (B) 25 years prior to collection year, and (C) 50 years prior to collection year. Dark vertical lines are correlation coefficients of zero. For all past year temperatures, see Figure 4—figure supplement 1.

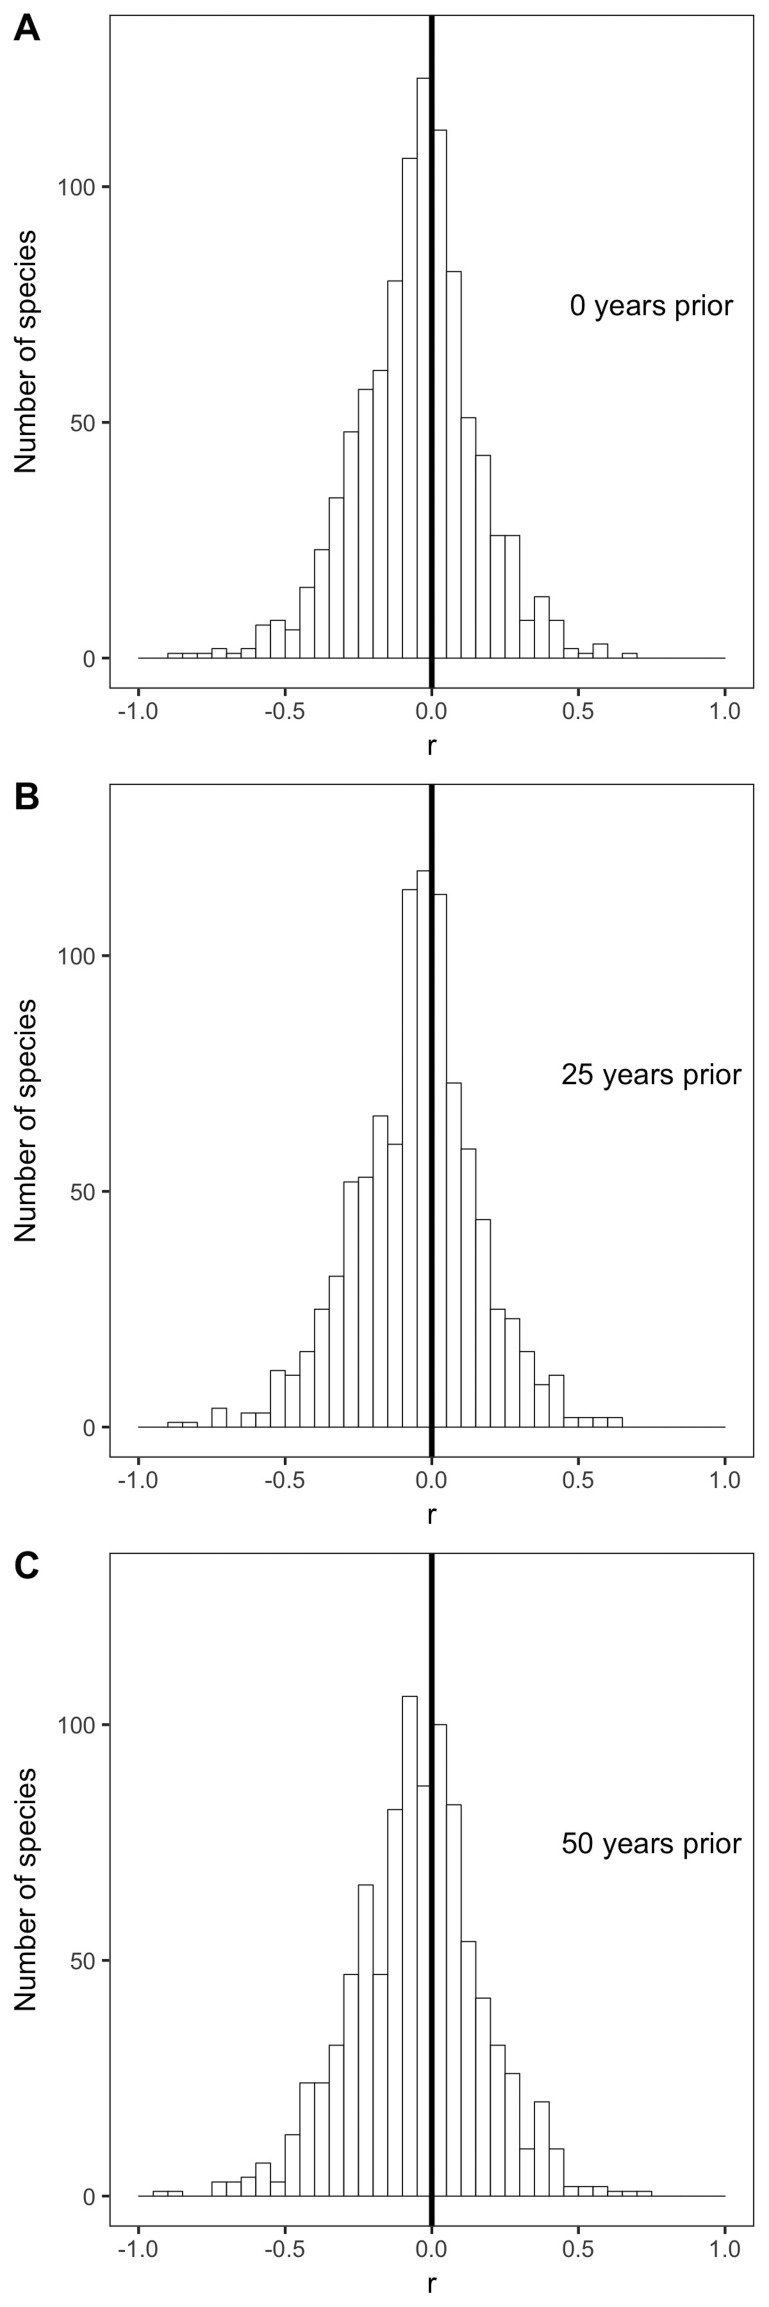
Figure 4.

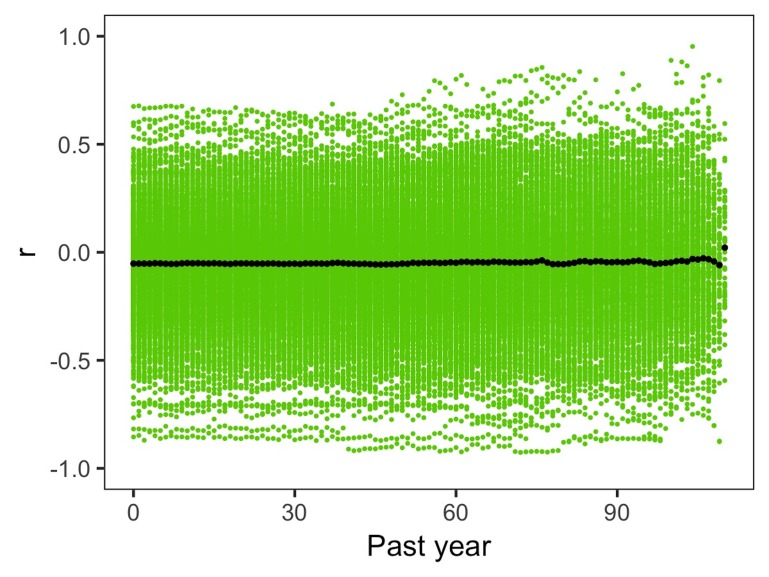
Figure 4—figure supplement 1. Species correlation coefficients for all past year temperatures.

Figure 4—figure supplement 1.

Distributions of correlation coefficients (r) for all species' intraspecific temperature-mass relationships with mean annual temperature for collection year to 110 years prior to collection year. Black points show mean correlation coefficient across species for each past year of temperature.