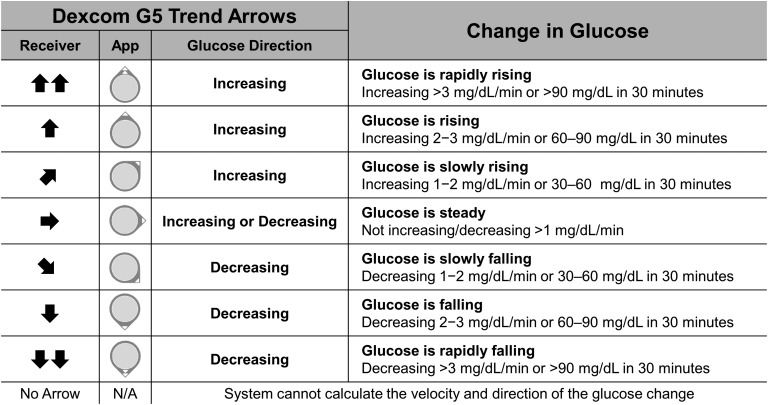
Figure 1.
Dexcom G5 trend arrows. Dexcom G5 presents trend arrow data as icons on the Dexcom G5 Receiver and on the Dexcom G5 Mobile and Dexcom Follow apps (App) on compatible smart devices. According to the manufacturer, trend arrows indicate rates of glucose change (mg/dL per minute) and can be described as the anticipated glucose change in 30 minutes. Notably, the FLAT arrow (➡) indicates steady glucose values but does not indicate zero change. Note that trend arrows are determined by recent rtCGM measurements (generally the most recent 10 minutes of glucose values). In general, anticipated glucose may be less accurate when trying to predict changes over extended periods of time (e.g., beyond 20 to 30 minutes) due to the many factors that may influence glucose levels. Conversion: mg/dL × 0.0555 = mmol/L.

