
Table 2.
Distribution of perceived weight status by age and gender
| ||||||||
|---|---|---|---|---|---|---|---|---|
| 1 | 2 | 3 | 4 | 5 | 6 | 7 | ||
| Total | 1.5 | 12.1 | 36.3 | 36.6 | 11.9 | 1.5 | 0.1 | |
| Boys | 9 | 1.4 | 4.0 | 26.1 | 51.2 | 15.0 | 2.3 | 0.0 |
| 13 | 1.7 | 15.0 | 41.2 | 27.4 | 13.4 | 1.2 | 0.2 | |
| 16 | 1.1 | 13.4 | 40.7 | 30.3 | 12.3 | 2.0 | 0.2 | |
| Girls | 9 | 2.4 | 8.5 | 27.3 | 49.7 | 11.3 | 0.9 | 0.0 |
| 13 | 1.7 | 19.5 | 43.3 | 26.8 | 7.8 | 0.9 | 0.0 | |
| 16 | 0.3 | 13.3 | 40.9 | 32.1 | 11.5 | 1.7 | 0.2 | |
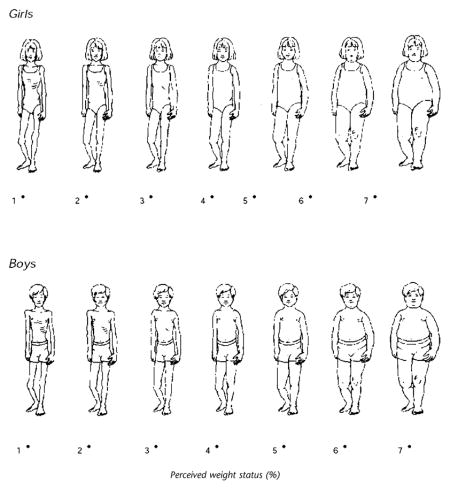
A separate gendered silhouette series was used for adolescents. Note: Figure drawings were developed by Collins31 and are being reprinted with permission of John Wiley & Sons Inc.