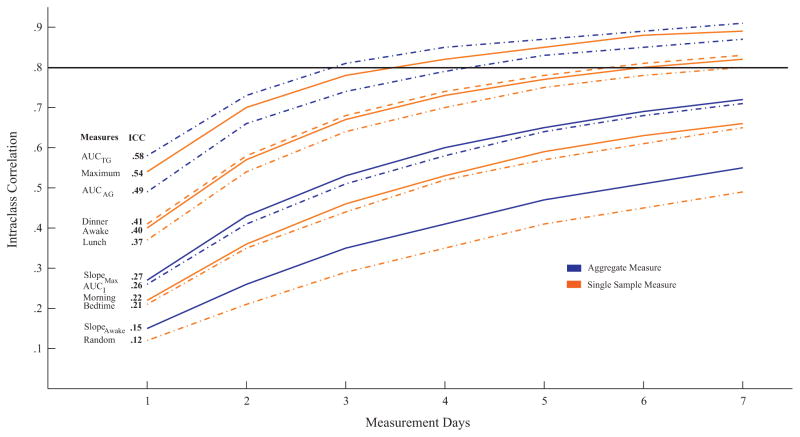
Figure 1.
The stability of aggregate and single sample cortisol measures over 1 week based on intra-class correlations (ICC). AUCAG, area under the curve relative to ground for the awakening response; AUCI, area under the curve relative to increase; AUCTG, area under the curve relative to ground for the diurnal profile; Morning, randomly selected sample from three morning samples; Random, randomly selected sample from all samples collected. Note: Line at .8 signifies optimal stability, and changes in line style used to ease interpretation of the figure.

