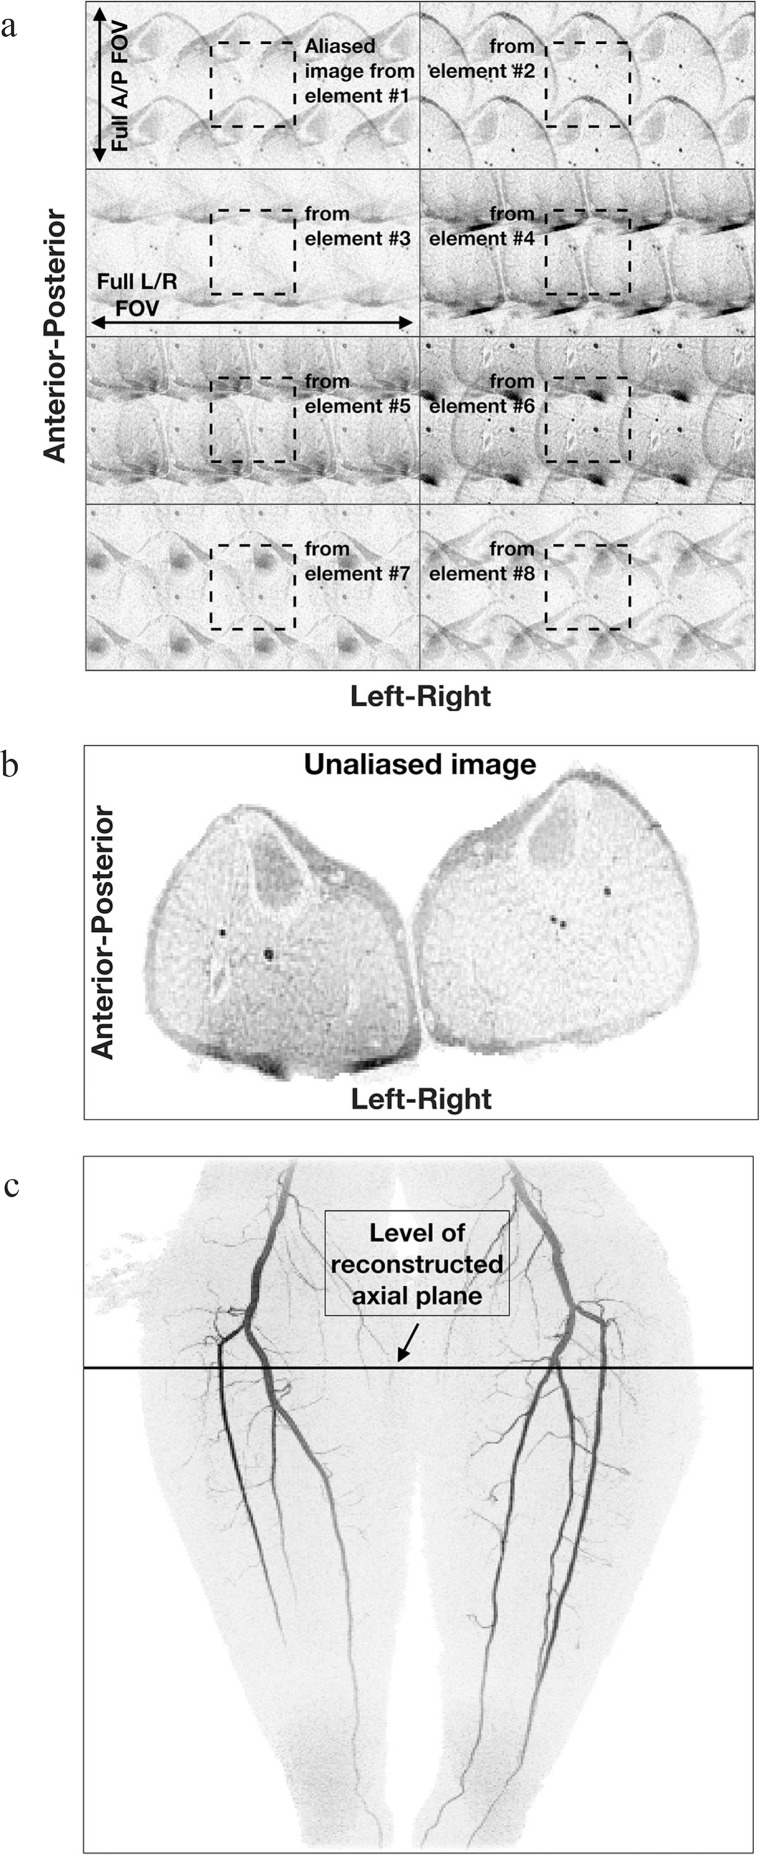
Fig. 1.
Illustration of 2D sensitivity encoding (SENSE) in contrast-enhanced MRA. (a) Acquired images of an axial section just distal to the knees from eight coil elements formed with acceleration factor R = 4 (left/right) × 2 (anterior/posterior) = 8. Note the differences image to image, owing to the different coil sensitivities across the object. Also note the relatively low signal level of the unenhancing background tissue. (b) Reconstructed axial image using the data of (a). (c) Maximum Intensity Projection (MIP) from contrast-enhanced magnetic resonance angiography (CE-MRA) study of the calves. The level of the axial section used in (a) and (b) is identified.

