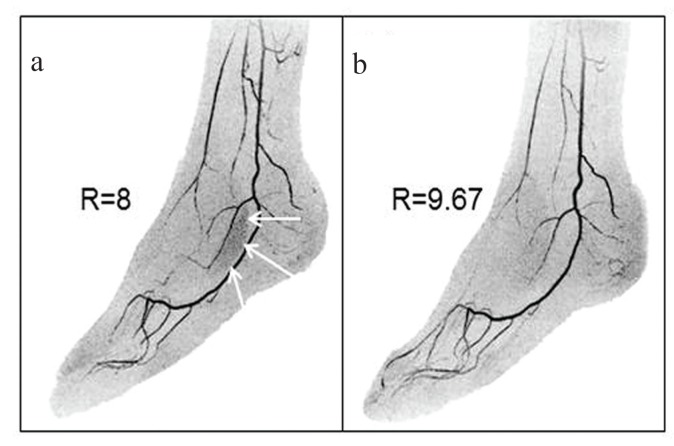
Fig. 2.
Illustration of acceleration apportionment. (a) Still image from time-resolved contrast-enhanced magnetic resonance angiography (CE-MRA) exam of the feet acquired with 2D sensitivity encoding (SENSE) with R = RY × RZ = 2 × 4 = 8. Note region of patchy noise (white arrows) which occurs in areas with a high level of aliasing with these acceleration factors. (b) Still image made from the same subject as (a) but acquired in a CE-MRA exam on a different day. Acceleration apportionment resulted in higher acceleration factor R = RY × RZ = 2.87 × 3.37 = 9.67 but also reduced noise in the problematic region identified in (a). Subtle differences in the degree of filling of contrast in the vasculature are due to slight day-to-day physiological differences. (Reprinted, with permission, from Weavers et al.30).

