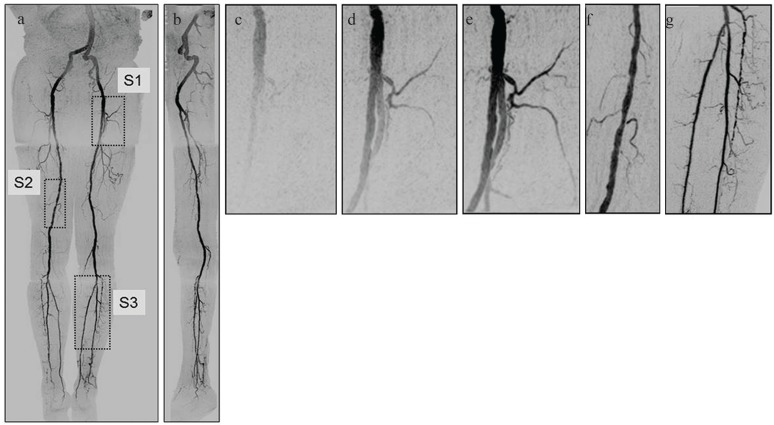
Fig. 3.
Illustration of fluoroscopic tracking acquired in 81-year-old male. (a) Coronal Maximum Intensity Projection (MIP) showing the peak arterial frame for each of the three stations used. (b) Sagittal MIP. (c–e) Targeted MIPs taken from region S1 from the first (pelvis) station of (a) showing the progressive filling of contrast-enhanced blood as seen in the real-time display. Frame time was 2.5 sec. Upon detecting distal arterial filling in the first (pelvis) station, the operator triggered table advance. (f) Targeted MIP taken from Region S2 of (a) from the second (thigh) station. This image was formed from data from only two 2.5 sec long frames. (g) Targeted MIP taken from Region S3 of (a) from the third (calves) station. Frame time is 5.2 sec. Although this subject was recruited as a healthy volunteer, multiple low-grade stenoses are seen in the thigh and calf arteries, and the anterior tibial artery seen in (g) is partially occluded. (Reprinted, with permission, from Johnson et al.34).

