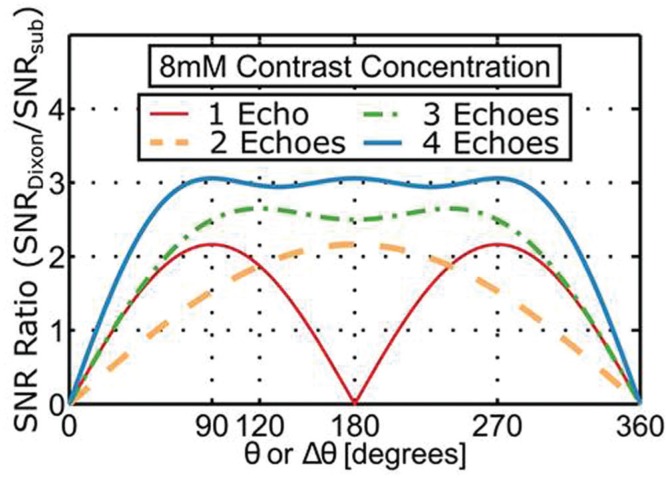
Fig. 6.
Plot of the ratio of signal-to-noise ratio (SNR) of Dixon vs. conventional time subtraction contrast-enhanced magnetic resonance angiography (CE-MRA) as a function of the fat-water phase angle between the gradient echo times used for an assumed 8 mm contrast concentration. For the single-echo case the angle is the absolute angle between the complex fat and water magnetizations. (Reprinted, with permission, from Stinson et al.51).

