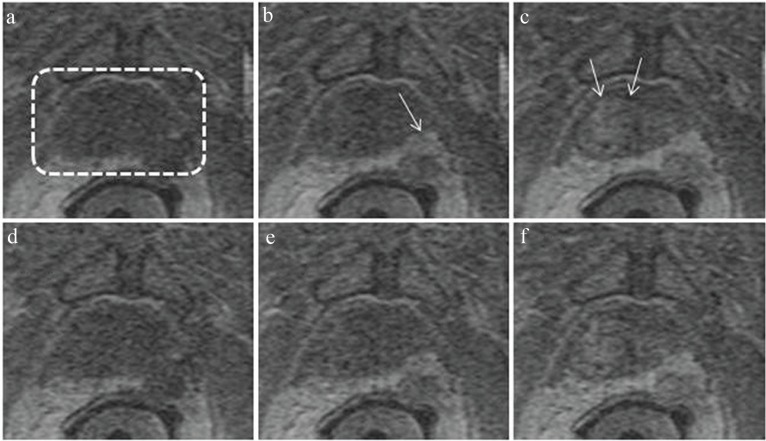
Fig. 7.
Illustration of dynamic contrast-enhanced-magnetic resonance imaging (DCE-MRI) of the prostate. Images are all subregions of an axial section through the prostate gland acquired with a DCE-MRI sequence with 6.5 sec frame time. The prostate is contained within the dashed box of (a). Images (a–c) were acquired with a 32-coil array at 32.5, 45.5, and 58.5 sec post intravenous injection of contrast material and illustrate progressive enhancement of posterolateral lesion (b, arrow) and central region (c, arrow). Images (d–f) were formed with using data from only 12 of the 32 coils, illustrating loss of signal-to-noise ratio (SNR).

