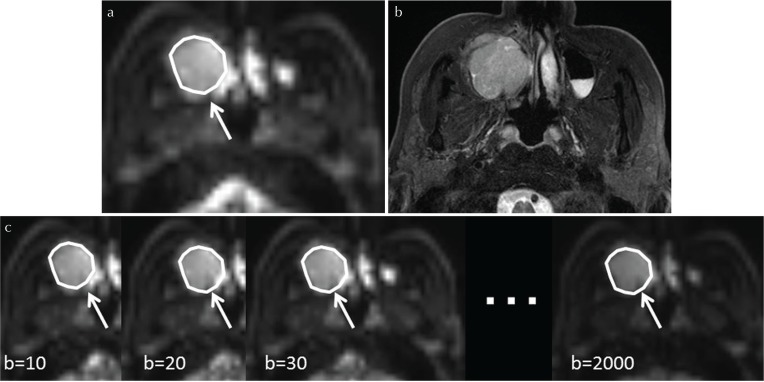
Fig. 1.
Tumor ROI delineation. Each primary tumor was outlined by a polygonal ROI on b0 images of diffusion weighted image (DWI) (a, arrow). T2-weighted images (T2WI) (b) were used as reference images for the ROI delineation. The tumor ROI was then copied on the echo-planar imaging (EPI) of the respective b-values (c, arrows).

