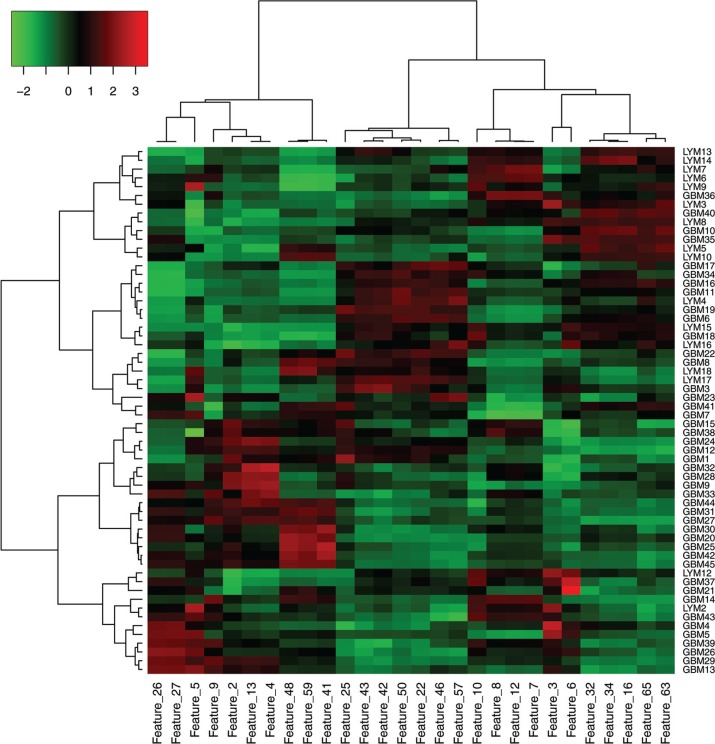
Fig. 4.
Hierarchical clustering between the texture features and the cases. The heatmap presentation with dendrograms shows how a texture feature expresses itself among the cases. Red indicates that the texture feature demonstrates a large positive z-score and green indicates that the texture feature demonstrates a large negative z-score. Each row of the heat map represents a specific texture feature across patients, and each column represents all features for a tumor. GBM, glioblastoma; LYM, primary central nervous system lymphoma.

