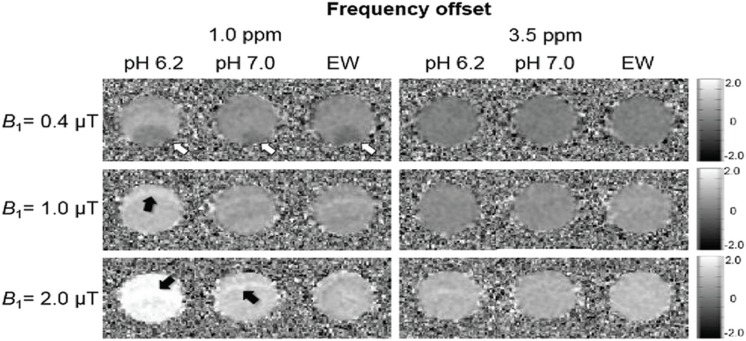
Fig. 4.
Asymmetric magnetization transfer ratio (MTRasym) images at 1.0 ppm and 3.5 ppm at each saturation pulse power. The pH 6.2 egg white (EW)_lactic acid (Lac) sample shows the highest value, at 1.0 ppm. The EW sample shows a higher value at 3.5 ppm. The low-intensity artifact is visible in all samples of 0.4 μT at 1.0 ppm (white arrow). The high-intensity artifact is visible in some samples of 1.0 and 2.0 μT at 1.0 ppm (black arrow). No artifacts are apparent in any samples at 3.5 ppm. The upper row represents 0.4 μT, the middle row, 1.0 μT, and the bottom row, 2.0 μT.

