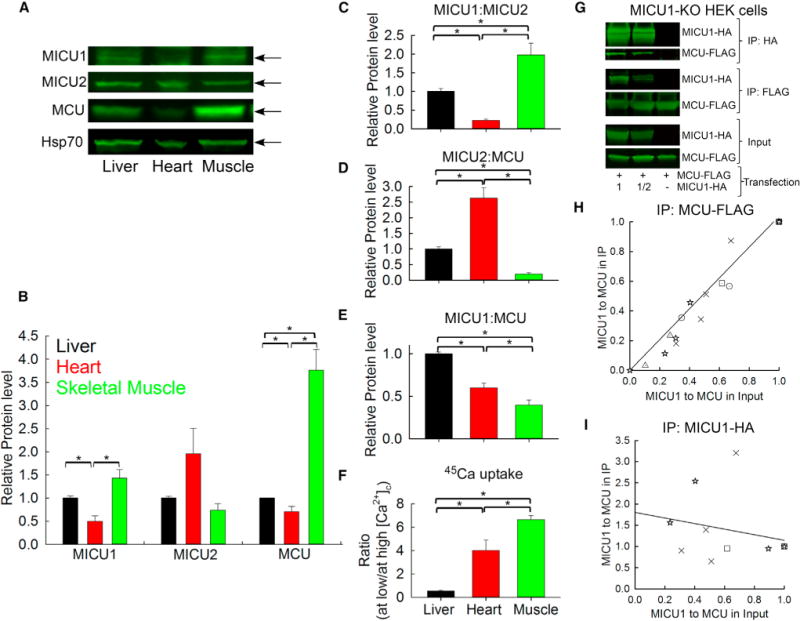
Figure 3. MICU1 to MCU Protein Expression Ratio Correlates Directly with MICU1 to MCU Association to Control the Threshold and Cooperative Activation of Mitochondrial Ca2+ Uptake in Tissues.

(A) Representative immunoblotting in reducing conditions of MICU1, MICU2, MCU, and Hsp70 (mitochondrial loading control) in mice liver, heart, and skeletal muscle mitochondrial lysates.
(B) Relative protein level of MICU1, MICU2, and MCU is displayed in the bar graph for each protein relative to Hsp70 and normalized to liver mitochondria.
(C–E) Protein ratios of MICU1 to MICU2 (C), MICU2 to MCU (D), and MICU1 to MCU (E) calculated individually for each mouse.
(F) Ratio between the Ca2+ accumulated at low [Ca2+]c and at high [Ca2+]c (from Figure 2C) for each experiment. Mean ± SEM; n = 4; *p < 0.05.
(G) HEK cells were co-transfected with MCU-FLAG and different levels of MICU1-HA to generate different MICU1 to MCU ratios. MCU-FLAG and MICU1 HA were co-immunoprecipitated either with specific FLAG-agarose beads or HA-agarose beads.
(H) MICU1 to MCU ratio was calculated for the input and after the MCU-FLAG IP and normalized so that the values at the highest MICU1 to MCU ratio in the input were set to 1 for each experiment, indicated by the different shaped dot plots (n = 5). The linear fit indicates that the higher the MICU1 expression, the higher the MICU1 pulled down by MCU.
(I) Similar calculations were performed as in (H) for the MICU1-HA IP (n = 3). The linear fit shows that the amount of MCU units bound to MICU1 is not changed by increasing the MICU1 expression.
See also Figures S2 and S3.
