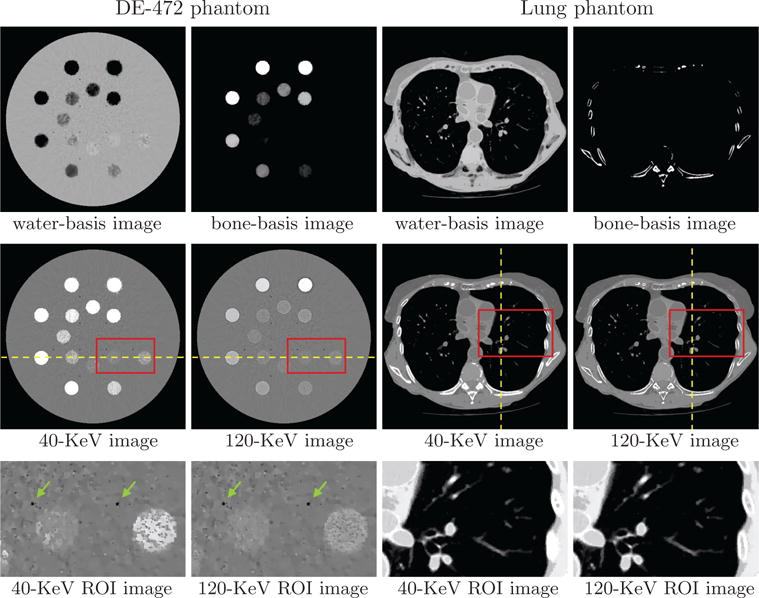
Figure 6.

Water- and bone-basis images (row 1), 40- and 120-KeV monochromatic images (row 2), and zoomed-in views of ROI images (row 3) enclosed by boxes in row 2 from full-scan data of the DE-472 and lung phantoms, respectively, with display windows [0, 1.5] (row 1), [−1000, 1000] HU (row 2), and [−500, 500] HU (row 3, DE-472 phantom) and [−1000, 200] HU (row 3, lung phantom). The dashed lines indicate the location of the profile plots in Fig. 7, while the arrows point to the air bubbles in the DE-472 phantom.
