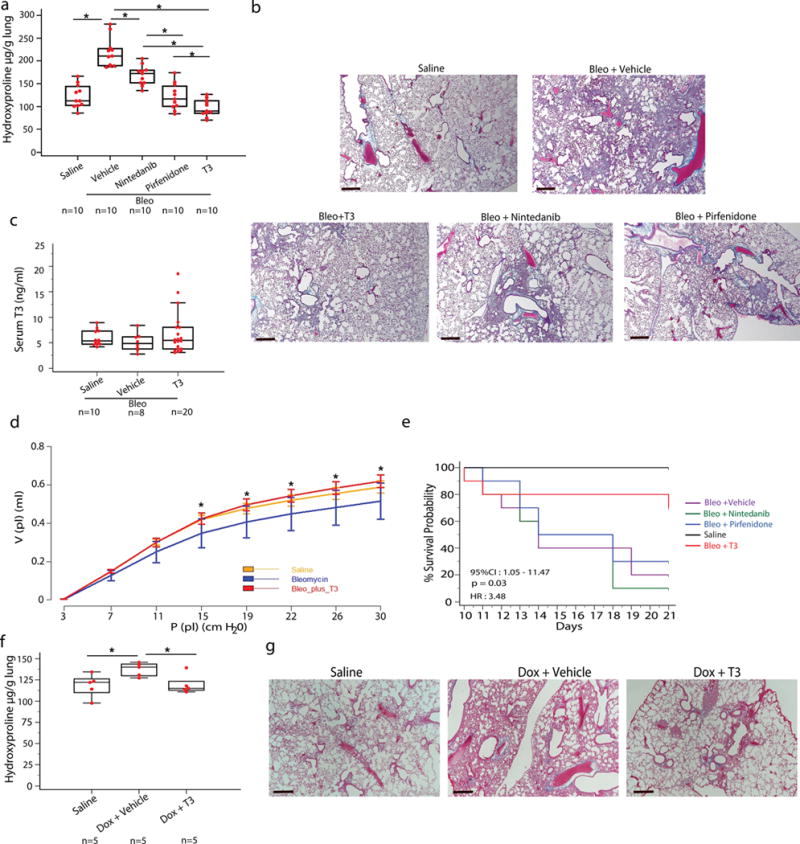
Figure 2.

Aerosolized T3 blunts established fibrosis in two murine models of lung fibrosis. (a) Effects of aerosolized T3, nintedanib or pirfenidone on lung hydroxyproline content. Data presented as box-and-whisker plots are from one of two independent experiments with similar results with horizontal bars representing mean hydroxyproline content per lung set (μg/gr) + SEM, *P < 0,001. (b) Masson’s Trichrome staining of representative lung sections (n = 5) from each group of treated mice. Scale bars, 50 μm. (c) Aerosolized T3 administration effects on T3 serum levels. Data are presented as box-and-whisker plots with horizontal bars representing mean T3 serum levels (ng/ml) + SEM, P = 0.7. (d) Pressure–volume-loops (PV-loops) of mice (n = 5/group) treated with aerosolized T3 following intratracheal challenge with bleomycin or normal saline, P < 0.001. (e) Kaplan-Meier plot survival plots of mice treated with aerosolized T3, pirfenidone, nintedanib or equivalent volume of vehicle following intratracheal challenge with double dose of bleomycin or normal saline, n = 10 mice/group. (f) T3 effects on hydroxyproline content in mice in the following groups: Saline – transgene not induced, Dox+vehicle - transgene induced animals treated with vehicle, DOX+T3 – transgene induced and animals treated with aerosolized T3. Data are presented as box-and-whisker plots with horizontal bars representing mean hydroxyproline content per lung set (μg/gr) + SEM, *P = 0.035. (g) Masson’s Trichrome staining of representative lung sections (n = 5) in the triple transgenic (CC10-rtTA-tTS-TGF-β1) in the groups from f. Scale bars, 50 μm. The statistical test used was one-way ANOVA with Student-Newman-Keuls post-hoc test for pairwise comparisons, (a) (F=38.6, df=54), (c) (F=0.6, df=56), (d) (F=11.9, df=44), (f) (F=4.5, df=14)
