
Figure 3.
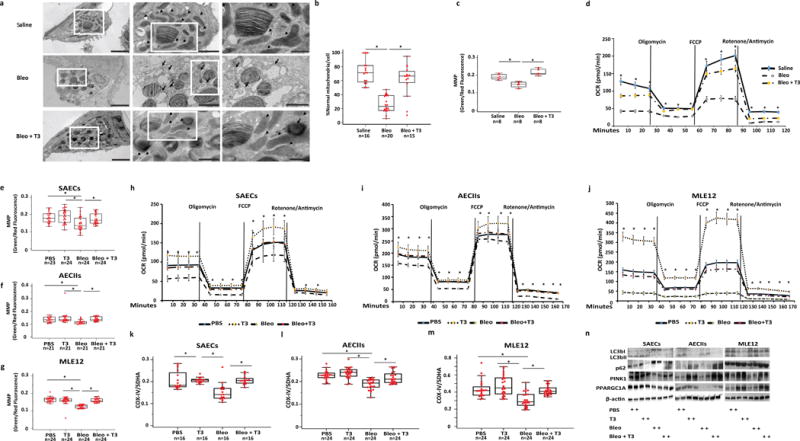
TH treatment restores bleomycin-induced mitochondrial abnormalities in alveolar epithelial cells. (a) Representative transmission electron microscopy (TEM) images (n = 16, 19 and 13, respectively) of AECIIs from mice treated with saline (upper panel), bleomycin (3.0U/kg) (middle panel) or bleomycin + aerosolized T3 (40μg/kg) (lower panel). Black arrows indicate damaged and swollen mitochondria with severely disrupted electron-lucent cristae, arrow heads indicate normal appearing mitochondria. Boxed regions are shown enlarged in the next column. Scale bars, 2 μM (left panels), 1 um (middle panels), 500 nm (right panels). (b) Quantitative analysis of the percentage of normal mitochondria per cell/group. Bars represent mean score + SEM, *P < 0,001. (c) Mitochondrial function in AECIIs cultured from animals treated with saline, bleomycin or bleomycin + T3. Data are presented as box-and-whisker plots with horizontal bars representing mean MMP levels (green/red fluorescence ratio) + SEM, *P < 0,001. (d) Oxygen consumption rate (OCR, pmol/min) was measured under basal conditions followed by addition of oligomycin, FCCP, rotenone and antimycin as indicated, *P < 0.001). (e–g) Green/red fluorescence ratio as a readout of MMP in primary human small airway epithelial cells (SAECs) (e), primary mouse AECIIs (f) and mouse lung epithelial cells (MLE12) (g) exposed to bleomycin or PBS and then treated with T3 or vehicle. Data are presented as box-and-whisker plots with horizontal bars representing mean MMP levels + SEM, *P < 0.001, P = 0.003 and P < 0.001, respectively). (h–j) Oxygen consumption rate (OCR, pmol/min) of the category of cells indicated in e–g as measured under basal conditions followed by addition of oligomycin (0.25μM), FCCP (1 μM), as well as rotenone and antimycin (1 μM), as indicated. (k–m) Effects of in vitro T3 treatment on mitochondrial biogenesis in the same category cells indicated in e–g as measured by the levels of Cytochrome c oxidase subunit IV (COX-IV) and Succinate Dehydrogenase Complex Flavoprotein subunit A (SDHA). Data are presented as box-and-whisker plots with horizontal bars representing mean COX-IV/SDHA ratio + SEM, *P < 0.001. (n) Immunoblot analysis of markers of autophagy (LC3BI, II, p62, PINK1) and mitochondrial biogenesis (PPARGCA1) in the same category of cells indicated in e–g. Immunoblot gels were cropped and uncropped images of the immunoblot gels are in Supplementary Figure 4. The statistical test used was One-way ANOVA with Student-Newman-Keuls post-hoc test for pairwise comparisons (b) (F=34.5, df=50), (c) (F=38.6, df=23) (d) (F=91.4, df=42), (e) (F=7.04, df=94) (f) (F=5.15, df=83) (g), (F=35.3, df=95), (k) (F=39.6, df=88), (l) (F=30.1, df=74), (m) (F= 74.6, df= 87).