
Figure 4.
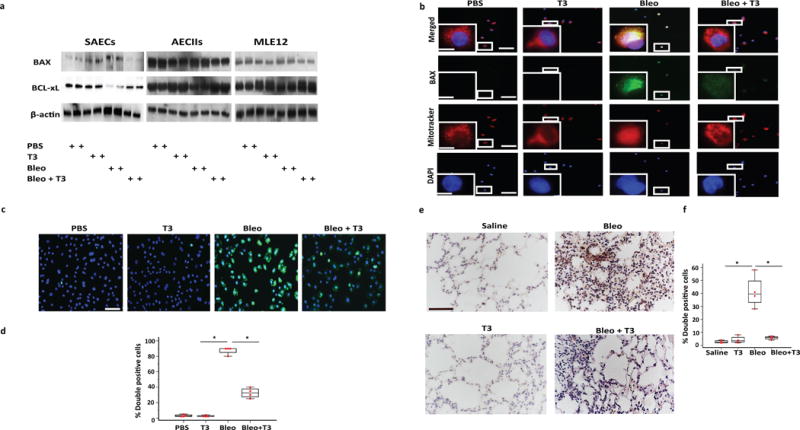
TH attenuates mitochondria-regulated apoptosis in lung epithelial cells. (a) Immunoblot analysis of markers of mitochondria-cell apoptosis (BAX, BCL-xL). Each lane represents a biological replicate and 2 experiments were done in each case. Immunoblot gels were cropped, and uncropped images of the immunoblot gels are in Supplementary Fig 4. (b) Immunofluorescence analysis for Mito-Tracker (red cationic dye that stains active mitochondria) and BAX (green) in SAECs after bleomycin or PBS exposure and treatment with or without T3. Localization of BAX with mito-tracker is indicated in yellow. Boxed regions are shown enlarged at lower left panels. Scale bars, 50μm, insets: 10 μm. (c,d) Immunofluorescence (c) and quantitative analysis (d) of double positive SAECs (TUNEL/DAPI). Data are presented as box-and-whisker plots with horizontal bars representing mean % percentage of double positive cells + SEM. One-way ANOVA (F=366.7, df=15) with Student-Newman-Keuls post-hoc test for pairwise comparisons, *P < 0.001. (e,f) Immunohistochemistry (e) and quantitative analysis (f) of TUNEL-positive cells in lung samples derived from mice challenged bleomycin or saline and then treated with T3 or vehicle at days 10–20. Data are presented as box-and-whisker plots with horizontal bars representing mean % percentage of double positive cells + SEM, *P < 0.001. Scale bars, 100μm. The statistical test used was one-way ANOVA (F=33.3, df=15) with Student-Newman-Keuls post-hoc test for pairwise comparisons.