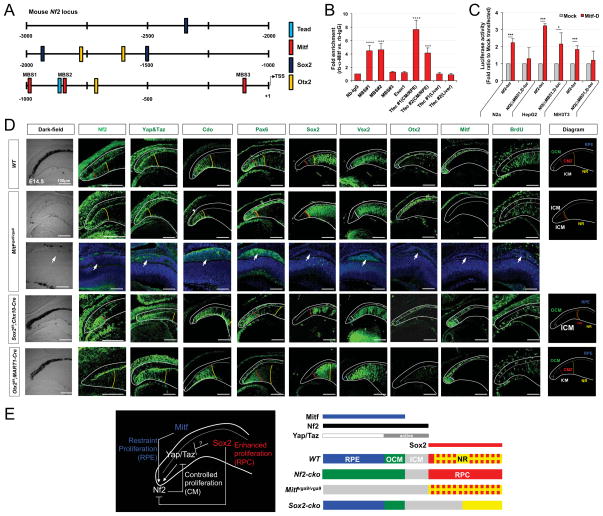
Figure 7. Antagonistic regulation of Nf2 expression by Mitf and Sox2 is necessary for differential growth of optic neuroepithelial compartments.
(A) Schematic distribution of putative transcription factor target sequences within −2.5kb upstream region of mouse Nf2 gene. TSS, transcription start site. (B) ChIP qPCR analyses of adult mouse optic cup devoid of the retina revealed the enrichment of Mitf transcription factor in its target M-box sequences (MBS) in the upstream region of Nf2 gene. The Tfec promoter sequences, which are know as targets of Mitf, were used for positive controls in each ChIP experiment (see details in Methods). (C) N2a, HepG2, and NIH3T3 cell lines were transfected with Nf2_luc reporters alone or together the RPE-enriched Mitf-D isoform and the effects of Mitf on luciferase expression were examined by detecting chemoluminoscence emitted by cell lysates (n=6). (D) Expression of Nf2 and Yap/Taz in P0 WT, Mitfmi-vga9/mi-vga9, Sox2f/f;Chx10-Cre, Otx2f/f;MART1-Cre mouse eyes was examined by immunostaining (second and third columns from the left). Distribution of CM (marked by Pax6), OCM/RPE (marked by Otx2 and Mitf), ICM (marked by Cdo and Vsx2), and RPC (marked by Vsx2 and Sox2) was also examined by immunostaining. Schematic diagrams showing the distribution of optic compartments in each mouse line are given in the rightmost column. Yellow dot-line indicates a border between the retina and ICM; red dot-line indicates a border between the proximal CM and distal CM; white dot-line indicate a border between the ICM and OCM. (E) Schematic diagram depicts regulation of Nf2 expression by transcription factors expressed in each optic neuroepithelial compartment.

