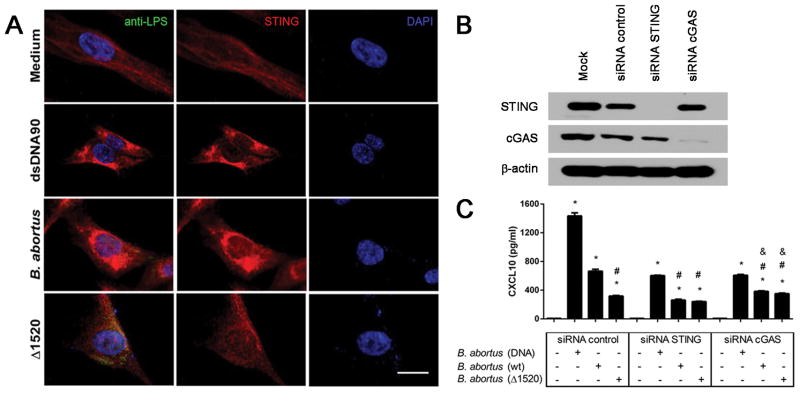
Figure 5. STING activation in human fibroblasts following B. abortus infection.
hTERT cells were transfected with dsDNA90 (3μg/mL) or infected with B. abortus strain 2308 or B. abortus Δ1520 mutant (MOI 1000:1) for 4 hrs, fixed and subjected to immunofluorescence microscopy analysis of STING. (A) Pronounced translocation of STING was observed as aggregated speck formation in the perinuclear region 4 hrs after cells were transfected with dsDNA90 or infected with B. abortus strain 2308 but not after infection with B. abortus Δ1520 mutant. Antibody staining is shown in the middle panels for STING (red) and nuclei staining (DAPI) is shown in blue on the right panels. Left panels are merged images from those shown on middle and right panels including staining with anti-Brucella LPS in green. Size bar shown corresponds to 25 μm in all panels. (B) hTERT cells were transfected with mock, control siRNA (non specific), STING siRNA or cGAS siRNA for 3 days. The efficiency of cGAS and STING silencing was demonstrated by immunoblotting, with β-actin serving as a loading control. (C) hTERT cells were transfected with B. abortus DNA, or infected with B. abortus strain 2308 or B. abortus Δ1520 mutant for 24 hrs and supernatants were collected for CXCL10 measurement by ELISA. Data are representative of three independent experiments and three replicates in each experimental group. Significant differences compared to untreated cells are denoted by an asterisk, compared to siRNA control plus Brucella are denoted by # and compared to siRNA STING plus Brucella are denoted by & (two-way ANOVA, p< 0.05).

