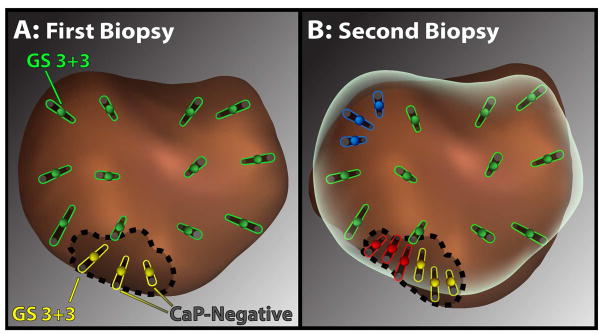
Figure 2.
Diagram showing an example of the biopsy methods used. First biopsy (A) consisted of 12 systematic cores (green), following the built-in template, and targeted cores (yellow) taken from the MRI visible lesion (dotted line). Second biopsy (B), which shows preliminary fusion of the first and second prostate models, consisted of systematic cores (green), MRI-targeted cores (yellow), and tracking cores taken from systematic cancer sites (blue) or cancerous sites within MRI-lesions (red). Using this scheme, resampling of all initial cancerous sites was achieved, both within and apart from MRI-visible lesions.

